S&P 500 – Further potential corrective decline below 2387/2395
 (Click to enlarge charts)
Key Levels (1 to 3 weeks)
Intermediate resistance: 2387
Pivot (key resistance): 2395
Supports: 2346 & 2330/21
Next resistances: 2406 & 2418
Medium-term (1 to 3 weeks) Outlook
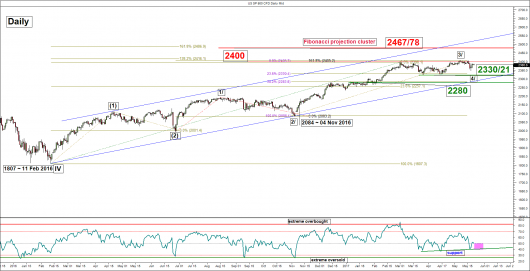
The S&P 500 Index (proxy for the S&P 500 futures) had managed to print a new all-time high of 2406 on 16 May 2017 but it fell short of our expected upside targets of 2418 and 2424. Thereafter, it declined and broke below the 2380 medium-term pivotal support reinforced by current political risks seen in U.S. President Trump administration that can delay the implementation of the proposed tax cuts and infrastructure spending plans.
Current key technical elements as follow:
- The next significant support rests at 2330/21 which is defined by the medium-term ascending channel’s lower boundary in place since 11 February 2016 low and the 23.6% Fibonacci retracement of the on-going multi-month up move from 04 November 2016 low to last week high of 2406 (see daily chart).
- The daily RSI oscillator has continued to inch downwards and still shows further potential downside before it reaches its ascending support at around 40%. These observations suggest that medium-term downside momentum of price action remains intact.
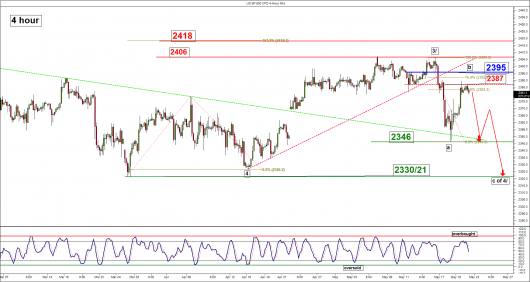
- The significant medium-term resistance now stands at 2395 which is closed to the 76.4% Fibonacci retracement of the recent decline from the current all-time high of 2406.
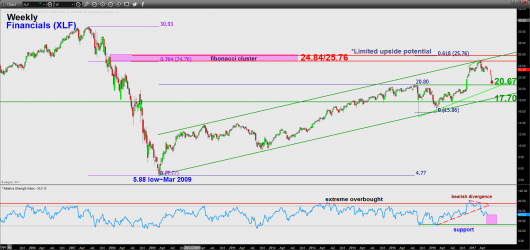
- Based on sector rotation analysis, one of the leading sectors in the post U.S. presidential election rally, the Financials has started to exhibit negative technical elements as seen from its ETF (XLF) where it may shape a further decline towards the 20.67 support. These observations can lead to further potential weakness in the S&P 500.
Therefore, we had turned bearish on the Index and as long as the 2395 medium-term pivotal resistance is not surpassed, it may see the start of another downleg to retest last week low of 2346 and a break below 2346 is likely to open up scope for a deeper decline to target the next support at 2330/21.
However, a clearance above 2395 is likely to invalidate the preferred bearish bias for a continuation of the up move to target 2418 next.
Nikkei 225 – Risk of a further corrective decline below 20000
 (Click to enlarge charts)
Key Levels (1 to 3 weeks)
Intermediate resistance: 19700/770
Pivot (key resistance): 20000
Supports: 19200/120 & 19030
Next resistance: 20950 (0.618 Fibonacci projection from 24 June 2016 low)
Medium-term (1 to 3 weeks) Outlook
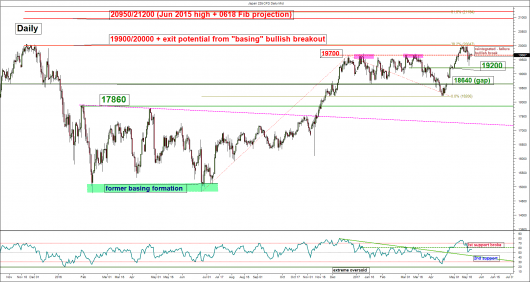
The Japan 225 Index (proxy for the Nikkei 225 futures) had staged a decline and broke below the 19700/600 pivotal support which invalidated the last push up scenario towards 20200.
Key technical elements remain negative as follow:
- The recent post French presidential election “risk on” rally has led to Index to stall at the 19900/20000 resistance (printed a high of 20025 on 09 May 2017) which is being defined by a confluence of elements. The medium-term swing high area of 01 December 2015, the exit target of the prior bullish breakout from the “basing formation” from 12 February 2016 to 24 June 2016. Based on the Elliot Wave Principal, a minimum primary degree impulsive up move 5th wave target derived from the 0.382 Fibonacci projection of the rally from 24 June 2016 low to 20 December 2016 high projected from the recent 17 April 2017 low.
- The daily RSI oscillator has exited from the overbought region and broke below its 1st support. Right now, it still has room to fall further before it reaches the 2nd support at around 41%. These observations suggest that medium-term downside momentum of price action remains intact.
- Price action has reintegrated back below the former 19700 range top from 20 December 2016 which suggests that the recent bullish breakout seen on 05 May 2017 is considered as failure (see daily chart).
- The next significant medium-term supports now rest at 19100/120 which is defined by the former congestion range top of 24 March/28 March 2017 and the 50% Fibonacci retracement of recent rally from 17 April 2017 low to 09 May 2017 high follow by 19030 (1.00 Fibonacci projection of the recent decline from 16 May 2017 high (see daily & 4 hour charts).
- The recent rebound from 18 May 2017 low of 19283 has reached the intermediate resistance zone of 19700/770 which also confluences with the 61.8% Fibonacci retracement of the recent decline from 16 May 2017 high to 18 May 2017 low. In addition, the 4 hour Stochastic oscillator has just exited from its overbought level which suggests the revival of downside momentum of price action.
Therefore, the Index may have completed its corrective rebound from 18 May 2017 low and now faces the risk of another downleg below the 19700/770 intermediate resistance to target the next support at 19200/120 with a maximum limit set at 19030
On the other hand, a clearance above the 20000 medium-term pivotal resistance opens up scope to resume the primary degree up move towards the next resistance at 20950.
Hang Seng Index – Medium-term upside momentum remains intact

 (Click to enlarge charts)
Key Levels (1 to 3 weeks)
Pivot (key support): 25000
Resistances: 25500 & 26120/170
Next supports: 24350 & 23720
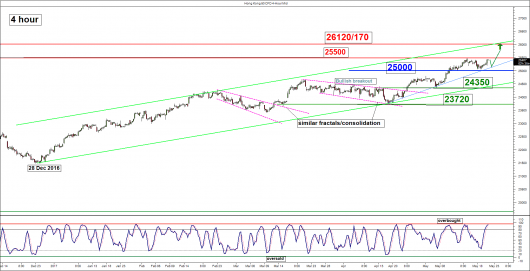
Medium-term (1 to 3 weeks) Outlook
Last week, the Hong Kong 50 Index (proxy for Hang Seng Index futures) had shaped the expected pull-back and printed a low of 25054 on 18 May 2017. It fell short of our pull-back target of 25000 by just 0.2%. Please click here for a recap on our previous weekly technical outlook report.
Current key technical elements as follow:
- The daily RSI oscillator has continued to inch upwards above its first support without any bullish exhaustion sign (bearish divergence). In addition, it still has potential room to manoeuvre to the upside before it reaches an extreme overbought level of 86% seen in April 2015 that corresponds with the 28620 major swing high of the Index printed on 27 April 2015. These observations suggest that medium-term upside momentum of price action remains intact.
- The Index has continued to evolve in a medium-term bullish ascending channel in place since 28 December 2016 low with its upper boundary now at 26120/170 that confluences with a Fibonacci projection level.
- In the shorter-term, current price action of the Index is being supported by an ascending trendline from 19 April 2017 low that is acting as a support at 25000 (see 4 hour).
- The shorter-term 4 hour Stochastic oscillator is now coming close to an extreme overbought level which suggests that the Index may shape a minor decline at this juncture.
Given the aforementioned positive medium-term positive elements, the Index may have completed the pull-back but in the short-term (1 to 3 days), a minor decline cannot be ruled out at this juncture towards the 25000 level. Therefore, we have tightened the medium-term pivotal support to 25000 and the bullish bias for another upleg to materialise to target the next resistance of 26120/170.
However, failure to hold above 25000 is likely to negate the preferred bullish tone to see a deeper decline to test the medium-term ascending channel support of 24350
ASX 200 – Further potential downside below 5805/5866 resistance
 (Click to enlarge charts)
Key Levels (1 to 3 weeks)
Intermediate resistance: 5805
Pivot (key resistance): 5866
Supports: 5674 & 5615/5580
Next resistances: 5960/6000 (long-term key resistance)
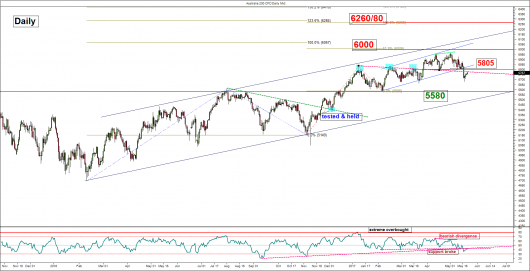
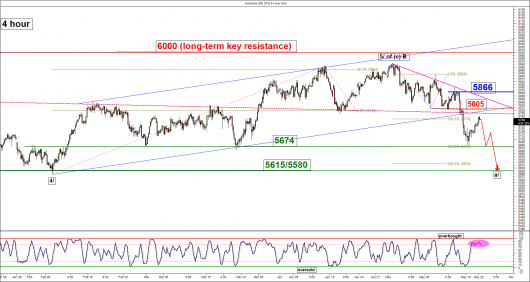
Medium-term (1 to 3 weeks) Outlook
The Australia 200 Index (proxy for the ASX 200 futures) had declined and broke below the 5800 downside trigger level as expected. It tumbled and almost met our downside target/support of 5674 (it printed a low of 5680 on 18 May 2017). Please click here for a recap on our previous weekly technical outlook report.
Technical elements remain negative and we maintain our bearish bias for a further potential decline to target the next support at 5615/5580 as long as the tightened medium-term pivotal resistance of 5866 is not surpassed.
On the other hand, a clearance above 5866 is likely to invalidate the preferred bearish scenario for a further squeeze up to retest the 5960/6000 long-term key resistance area.
DAX – Further potential corrective decline below 12730

 (Click to enlarge charts)
Key Levels (1 to 3 weeks)
Pivot (key resistance): 12730
Supports: 12400 & 12250
Next resistances: 12900 & 13130
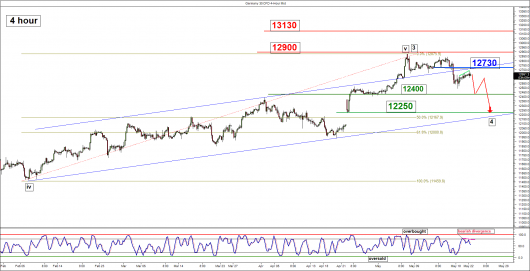
Medium-term (1 to 3 weeks) Outlook
Last week, we had turned neutral in terms of directional bias on the Germany 30 Index (proxy for the DAX futures) as the post French presidential election’s rally had almost reached a risk level of 12900. Indeed, the Index had shaped a reversal right below 12900 (printed a high of 12877 on 08 May 2017) and broke below the 12660 lower neutrality zone. Please click here for a recap on our previous weekly technical outlook report.
Current key technical elements as follow:
- Despite last week’s slide seen in the Index, it is still evolving within a medium-term ascending channel in place since 04 November 2016 low with its lower boundary acting as a support at 12250 (see daily chart).
- The aforementioned ascending channel support of 12250 also confluences with upper limit of the gapped out seen after the outcome of first round of the French presidential election on 24 April 2017 and the 23.6% Fibonacci retracement of the up move from 04 November 2016 low to the recent 08 May 2017 high (see daily chart).
- The daily RSI oscillator has continued to inch downwards and still has potential room for further downside before it reaches its corresponding support. In addition shorter-term 4 hour Stochastic oscillator has flashed a bearish divergence signal at its overbought region. These observations suggest that medium-term downside momentum of price action remains intact.
- The significant medium-term resistance now stands at 12730 which is defined by the 61.8% Fibonacci retracement of the recent decline from 08 May 2017 high to 18 May 2017 low and the former minor swing low area of 11 May/17 May 2017.
Therefore, we turn bearish on the Index and as long as the 12730 medium-term pivotal resistance is not surpassed, the Index is likely to shape a further potential downleg to target the next supports at 12400 follow by 12250 next.
However, a clearance above 12730 may invalidate the preferred bearish bias to see a squeeze up to retest 12900 and even 13130 next.
Charts are from City Index Advantage TraderPro & eSignal
Disclaimer
The material provided herein is general in nature and does not take into account your objectives, financial situation or needs. While every care has been taken in preparing this material, we do not provide any representation or warranty (express or implied) with respect to its completeness or accuracy. This is not an invitation or an offer to invest nor is it a recommendation to buy or sell investments. City Index recommends you to seek independent financial and legal advice before making any financial investment decision. Trading CFDs and FX on margin carries a higher level of risk, and may not be suitable for all investors. The possibility exists that you could lose more than your initial investment further CFD investors do not own or have any rights to the underlying assets. It is important you consider our Financial Services Guide and Product Disclosure Statement (PDS) available at www.cityindex.com.au, before deciding to acquire or hold our products. As a part of our market risk management, we may take the opposite side of your trade. GAIN Capital Australia Pty Ltd (ACN 141 774 727, AFSL 345646) is the CFD issuer and our products are traded off exchange.


