S&P 500 – Pull-back/consolidation likely ended, eyeing a potential new all-time high
 (Click to enlarge charts)
Key Levels (1 to 3 weeks)
Intermediate support: 2420/18
Pivot (key support): 2403
Resistances: 2446. 2456 & 2467/76
Next support: 2354
Medium-term (1 to 3 weeks) Outlook
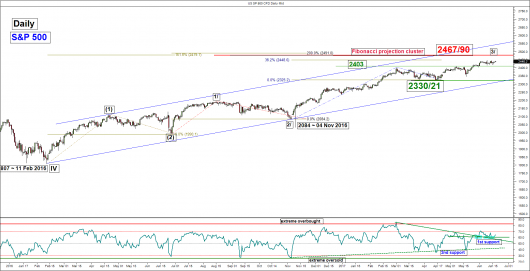
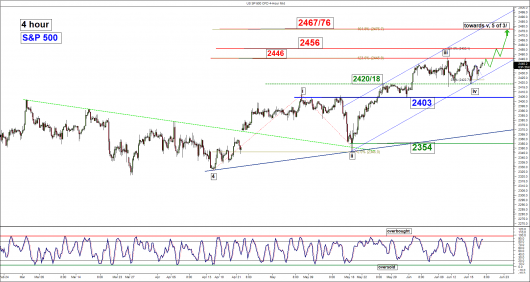
Last week, the S&P 500 Index (proxy for the S&P 500 futures) had staged the expected pull-back to retest the minor range bottom/support of 2020/18 in place since 09 June 2016 low before it attempted another rally towards its current all-time high level of 2446 (printed a high of 2433 on last Fri, 16 June). Key technical elements remain positive as follow:
- The daily RSI oscillator of the Index has managed to hold above its corresponding first support at the 60% level which suggests that medium-term upside momentum of price action remains intact.
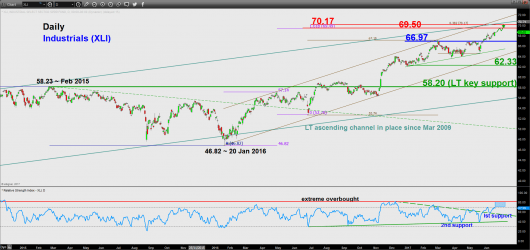
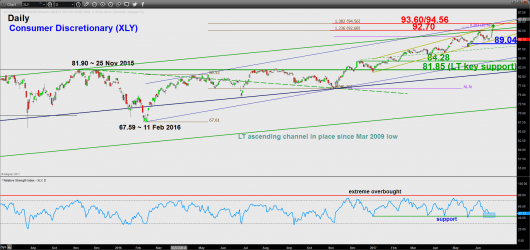
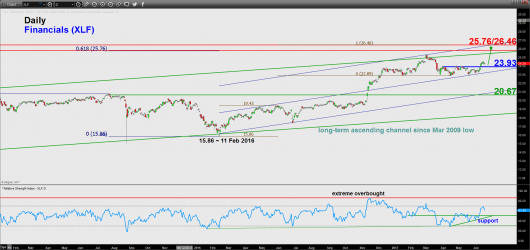
- Despite being trapped in a sideway range configuration between 2446 and 2420, its “risk-on” sectors (Industrials, Consumer Discretionary & Financials) have continued to exhibit bullish technical elements as seen on their respective sectors’ ETF (refer to the last 3 charts). Therefore from a sector rotation analysis perspective, the S&P 500 may shape a bullish breakout from its range soon due to the positive technical elements that has continued to exhibit in the charts of the Industrials, Consumer Discretionary & Financials sectors’ ETF.
- The next significant medium-term resistance of the Index stands at the 2467/76 zone which is defined by the upper boundary of a short-term bullish ascending in place since 18 May 2017 low and a Fibonacci projection cluster (see daily & 4 hour charts).
Therefore, we are maintaining our bullish bias and expect a potential bullish breakout above its 2446/2420 range to target its next resistances at 2456 follow by 2467/76 next.
On the other hand, failure to hold above the 2403 medium-term pivotal support is likely to put on hold the preferred bullish bias to open up scope for a deeper corrective decline to retest the 2354 ascending trendline support from 17April 2017 low.
Nikkei 225 – Bullish breakout, further potential upside above 19890/740 support
(Click to enlarge charts)
Key Levels (1 to 3 weeks)
Intermediate support: 19890
Pivot (key support: 19740
Resistances: 20500 & 20950/21100
Next supports: 19280 & 18860/640
Medium-term (1 to 3 weeks) Outlook
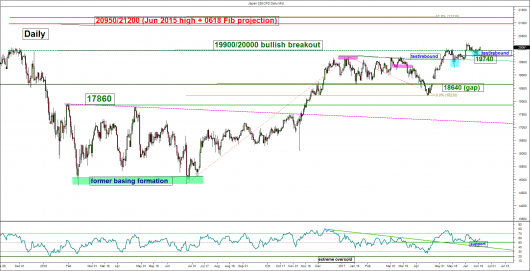
The Japan 225 Index (proxy for the Nikkei 225 futures) had indeed staged the expected bullish breakout from the upper boundary of the “Bullish Flag” continuation pattern in place since 02 June 2017 high in today’s (19 June) early Asian session; in line with the early bullish breakout seen on the USD/JPY in last Thursday, 15 June. Click here for a recap on our previous weekly technical outlook.
Current key positive technical elements are as follow:
- The daily RSI oscillator has managed to test and staged a rebound on its corresponding support at the 50% level. In addition, it still has ample room to manoeuvre to the upside before it reaches an extreme overbought level of 80% which has preceded the recent medium-term range resistance formed in 04 January/13 March 2017. These observations suggest the medium-term upside momentum of price action remains intact.
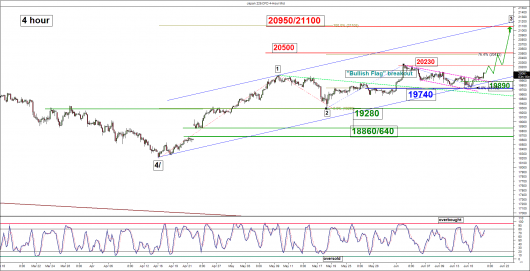
- Current price action has staged a bullish breakout from the “Bullish Flag” continuation pattern with its broken upper boundary now turns into a pull-back support at 19890 which also coincides with the lower boundary of a short-term ascending channel in place since 17 April 2017 low (see 4 hour chart).
- The key medium-term support now rests at 19740 which is defined by last Wed, 14 June swing low and a Fibonacci cluster (see 4 hour chart).
- The next significant medium-term resistances stands at 20500 follow by 20950/21100 which is defined by major swing high area of 24 June/11 August 2015, the upper boundary of a short-term ascending channel in place since 17 April 2017 and the 1.00 Fibonacci projection of the up move from 17 April 2017 low to 10 May 2017 minor swing high of 20025 projected from 18 May 2017 minor swing low of 19283) (see 4 hour chart).
Therefore, the Index is likely to have completed its 2-weeks of minor/short-term corrective decline from 02 June 2017 high and it is now resuming the bullish impulsive upleg of the medium-term uptrend in place since 16 April 2017 low. As long as the 19740 medium-term pivotal support holds, it may see a further up move to target the next resistance at 20500 follow by 20950/21100 next.
On the other hand, failure to hold above the 19740 is likely to invalidate the preferred bullish bias and indicates a failure bullish breakout to revive the bears for a corrective decline towards the next supports at 19280 and 18660/640 (gap that was formed after the outcome of the 1st round of the French presidential election).
Hang Seng – Short-term mean reversion decline likely ended, continuation of up move
 (Click to enlarge charts)
Key Levels (1 to 3 weeks)
Intermediate support: 25485
Pivot (key support): 25000
Resistances: 26335/400 & 26960
Next support: 23700/400
Medium-term (1 to 3 weeks) Outlook
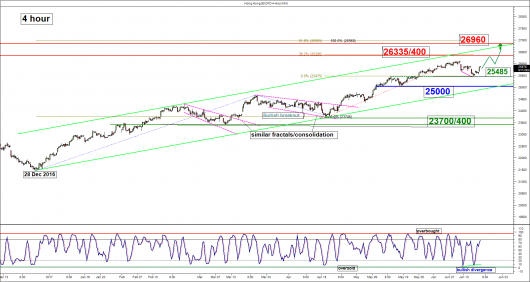
Last week, the Hong Kong 50 Index (proxy for Hang Seng Index futures) had staged the anticipated pull-back from its recent 09 June 2017 minor swing high area of 26110 and printed a low of 25485. Click here for a recap on our previous weekly technical outlook.
Latest technical elements and intermarket analysis have suggested that the Index’s short-term mean reversion may have bottomed out at last week’s low of 25485 instead of the earlier forecasted level of 25060. Details as follow:
- The daily RSI oscillator has managed to hold at its corresponding ascending trendline support at the 50% level. In addition, the shorter-term 4 hour Stochastic oscillator has flashed a bullish divergence signal at its extreme oversold level concurrently. These observations suggest a revival of upside momentum of price action.
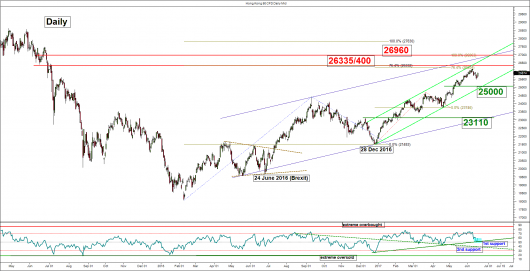
- The key medium-term support now rests at 25000 which is defined by the lower boundary of a medium-term ascending channel in place since 28 December 2016 low and the 23.6% Fibonacci retracement of the on-going uptrend in place since 28 December 2016 low to the recent 09June 2017 high (see daily & 4 hour charts).
- The next significant medium-term resistances stands at 2335/400 and 26960 which is defined by a Fibonacci projection cluster and the upper boundary of the aforementioned medium-term ascending channel (see 4 hour chart).
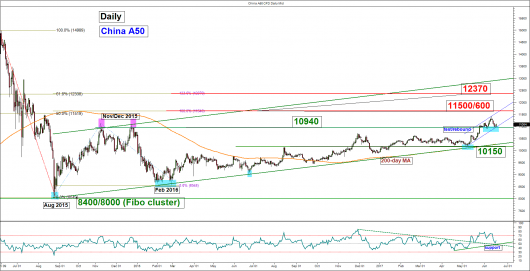
- Based on intermarket analysis, the China A50 Index (a benchmark index that comprises the 50 largest “A” shares listed on the Shanghai & Shenzhen stock exchanges) had staged a bullish breakout two weeks ago from a major resistance of 11000/10940 formed in November/December 2015. Interestingly, it pull-backed last week and retested the 11000/10940 prior resistance before it staged a rebound today (19 June). Current technical elements are positive which advocates for a potential new upleg to target the next medium-term resistance at 11500/600. Given its high direct correlation with the Hang Seng Index since May 2017, a further up move in the China A50 is likely to reinforce a potential bullish movement in the Hang Seng Index (refer to the 3rd chart).
Therefore, we have tightened the medium-term pivotal support to 25000 and expect it to shape a potential new upleg at this juncture to target the next resistances at 236335/400 follow by 26960 next.
However, failure to hold above 25000 may jeopardise the preferred bullish bias to see a deeper corrective decline towards the next support at 23700/400 (former congestion swing lows area of 09 March/19 April 2017 & the 50% Fibonacci retracement of the on-going up move since 28 December 2016 low).
ASX 200 – Mixed elements, turn neutral
 (Click to enlarge charts)
Key Levels (1 to 3 weeks)
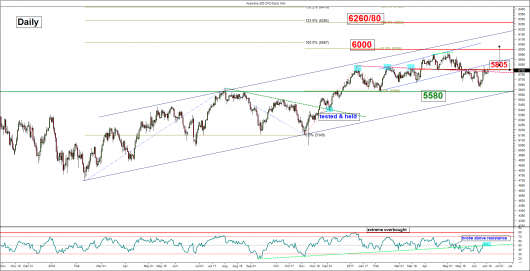
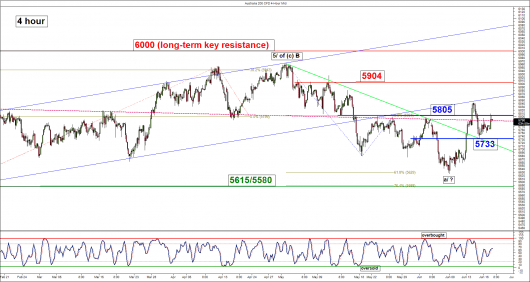
Resistances: 5805 & 5904
Supports: 5733 & 5615/5580
Medium-term (1 to 3 weeks) Outlook
Last week, the Australia 200 Index (proxy for the ASX 200 futures) had challenged the 5805 medium-term pivotal resistance but did not have a clear bullish break (no daily close above it) and traded sideways thereafter.
However, momentum had turned positive for the Index as the daily RSI oscillator had breached above its former resistance at the 50% level which indicates a bullish pre-signal in price action of the Index.
Therefore, we have decided to turn neutral at this juncture between 5805 and 5733. Only a break below 5733 is likely to reinstate the bearish tone for a further decline target the next support zone of 5615/5580.
DAX – Due for a potential bullish breakout

 (Click to enlarge charts)
Key Levels (1 to 3 weeks)
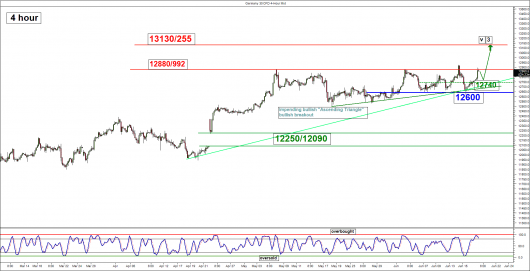
Intermediate support: 12740
Pivot (key support): 12600
Resistances: 12880/992 & 13130/255
Next support: 12250/12090
Medium-term (1 to 3 weeks) Outlook
Last week, the Germany 30 Index (proxy for the DAX futures) had continued to trade sideways below its intermediate resistance zone of 12880/12600. However, positive technical elements have started to emerge to suggest a potential bullish breakout from its current range configuration as follow:
- The daily RSI oscillator has managed to hold and staged a rebound right at its corresponding first support at the 50% level which suggests that medium-term upside momentum remains intact.
- On the shorter-term 4 hour chart, the Index has started to traced out a bullish “Ascending Triangle” chart configuration in place since 18 May 2017 minor swing low that indicates a continuation of its on-going medium-term uptrend from 09 November 2016 low.
- Current price action of the Index is now coming close to the 12880/992 intermediate resistance (the range top of the aforementioned “Ascending Triangle”). In addition, the 4 hour Stochastic oscillator has reached its extreme overbought level which highlights the risk a minor pull-back at this juncture.
- The medium-term resistance remains at 13130/255.
Therefore, we are maintaining our bullish bias and expect the on-going one month consolidation to end soon after a possible slide towards its intermediate support at 12740 with a maximum limit set at the 12600 medium-term pivotal support. Thereafter, a potential bullish breakout is likely to materialise to target the next resistance at 13130/255.
However, failure to hold above 12600 is likely to invalidate the preferred bullish bias to open up scope for a corrective decline towards the 12250/12090 gap support seen after the outcome of the 1st round of the French presidential election.
Charts are from City Index Advantage TraderPro & eSignal
Disclaimer
The material provided herein is general in nature and does not take into account your objectives, financial situation or needs. While every care has been taken in preparing this material, we do not provide any representation or warranty (express or implied) with respect to its completeness or accuracy. This is not an invitation or an offer to invest nor is it a recommendation to buy or sell investments. City Index recommends you to seek independent financial and legal advice before making any financial investment decision. Trading CFDs and FX on margin carries a higher level of risk, and may not be suitable for all investors. The possibility exists that you could lose more than your initial investment further CFD investors do not own or have any rights to the underlying assets. It is important you consider our Financial Services Guide and Product Disclosure Statement (PDS) available at www.cityindex.com.au, before deciding to acquire or hold our products. As a part of our market risk management, we may take the opposite side of your trade. GAIN Capital Australia Pty Ltd (ACN 141 774 727, AFSL 345646) is the CFD issuer and our products are traded off exchange.


