S&P 500 – Still holding above 2403 key support
 (Click to enlarge charts)
Key Levels (1 to 3 weeks)
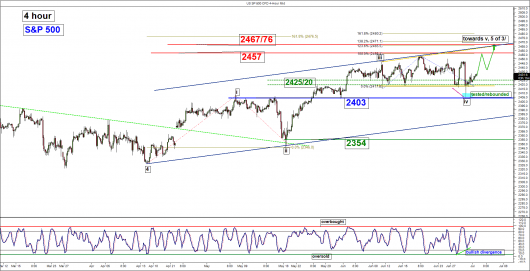
Intermediate support: 2420
Pivot (key support): 2403
Resistances: 2457 & 2467/76
Next support: 2354
Medium-term (1 to 3 weeks) Outlook
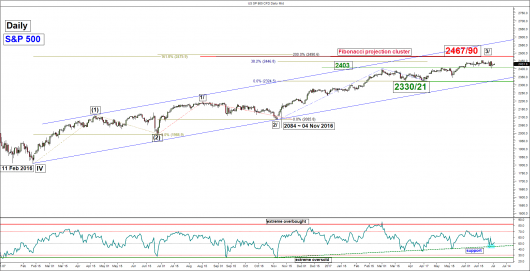
Last week, the S&P 500 Index (proxy for the S&P 500 futures) had breached below the 2420 intermediate range support in place since 10 June 201 on last Thurs, 30 June 2017 in the U.S. session triggered by a sell-off in the “FAANG” technology stocks (Facebook, Amazon, Apple, Netflix & Google/Alphabet) where they caused the S&P 500 Technology ETF (XLK to shed by 3.3%, the worst weekly decline since 31 October 2016).
Interestingly, last Thurs, 30 June 2017 sell-off stalled right above the 2403 predefined medium-term pivotal support (printed a low of 2404) and managed to stage a rebound towards the end of the week. Click here for a recap on our previous weekly technical outlook.
Current key elements as follow:
- The daily RSI oscillator has tested and rebounded from a corresponding trendline support at the 44% level. These observations suggest that medium-term downside momentum has not resurfaced.
- Last week’s sell-off in technology stocks did not spread the rest of the “risk-on” sectors such as the Industrials and Consumer Discretionary. In addition, the Financials has regained its leadership position as it recorded a gain of 18.38% since 09 November 2016, post-U.S. presidential election reinforced by the approval from U.S. Federal Reserve that had allowed the 34 largest U.S. banks to use their extra capital for stock buybacks, dividends and other purposes beyond being a cushion against financial catastrophe (refer to the 3rd chart).
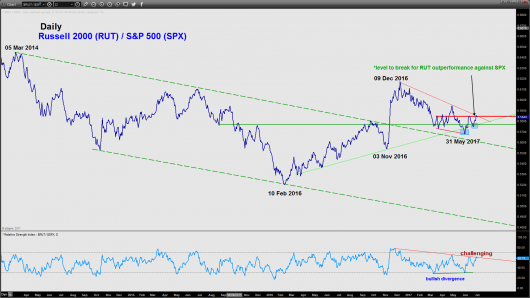
- The relative strength chart analysis of Russell 2000 versus S&P 500 has indicated that the recent underperformance of Russell 2000 in place since 09 December 2016 has started to ease as it continues to inch upwards. It is now challenging a critical resistance level and a break above it will indicate a Russell 2000 outperformance against S&P 500. These observations suggest that “confidence” has returned to the higher risk small-cap stocks (refer to the 4th chart).
- The significant medium-term resistance of the Index remains at the 2467/76 zone which is defined by the upper boundary of a short-term ascending channel in place since 17 April 2017 low and a Fibonacci projection cluster (see daily & 4 hour charts).
Therefore, from a sector rotation analysis perspective and the potential impending outperformance of small-caps (Russell 2000) against the S&P 500 do not indicate a medium-term top in the making but rather a potential consolidation phase.
Therefore, we are maintaining our bullish bias on the Index as long as the 2403 medium-term pivotal support holds for a further potential upleg to target a marginal new all-time high of 2457 before 2467/76 next.
On the other hand, failure to hold above 2403 is likely to invalidate the preferred bullish scenario to open up scope for a corrective decline to retest the next support at 2354 in the first step.
Nikkei 225 – Still holding above supports for potential upleg

 (Click to enlarge charts)
Key Levels (1 to 3 weeks)
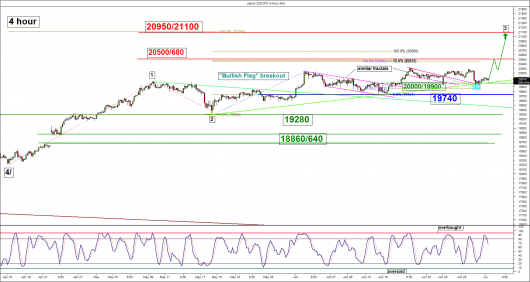
Intermediate support: 20000/19900
Pivot (key support): 19740
Resistances: 20500/680 & 20950/21100
Next supports: 19280 & 18860/640
Medium-term (1 to 3 weeks) Outlook
Last week, the Japan 225 Index (proxy for the Nikkei 225 futures) had traded sideways, tested and held at the 20000/19900 intermediate support.
No change in technical elements. We maintain our bullish bias above the 19740 medium-term pivotal support for a potential upleg to target the next resistances at 20500/660 follow by 20950/21100 next.
On the other hand, a break (daily close) below 19740 is likely to invalidate the preferred bullish scenario to open up scope for a corrective decline towards the next supports at 19280 and 18660/640 (gap that was formed after the outcome of the 1st round of the French presidential election).
Hang Seng – Due for a potential bullish breakout above 25500/25000 support
 (Click to enlarge charts)
Key Levels (1 to 3 weeks)
Intermediate support: 25500
Pivot (key support): 25000
Resistances: 26335/400 & 26960
Next support: 23700/400
Medium-term (1 to 3 weeks) Outlook
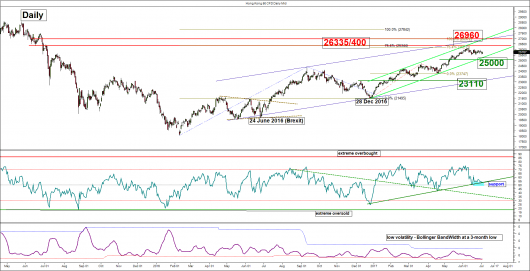
The Hong Kong 50 Index (proxy for Hang Seng Index futures) had continued to trade in a sideways environment within a contracting range from 2.2% to 1.5% in the past three weeks since 09 June 2017.
Current key technical elements as follow:
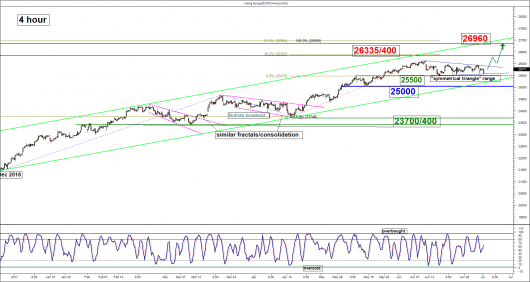
- Based on the Elliot Wave principal and fractal analysis, the on-going consolidation seen within the aforementioned “symmetrical triangle” range configuration in place since 09 June 2017 high is likely to be coming to an end. Also, it is now coming close to the “apex” of the triangle.
- In addition, volatility has been compressed to a low level relatively as the daily Bollinger Band Width indicator has dipped into a 3-month low reading since April 2017. These observations suggest that the Index is now due to a volatility breakout (see daily chart).
- The daily RSI oscillator has managed to hover right above its corresponding ascending trendline support at the 53% level. This observation suggests a lack of downside momentum.
- The intermediate support rests at 25500 which is the base of the minor “symmetrical triangle” range configuration in place since 09 June 2017 high (see 4 hour chart).
- The key medium-term support remains at 25000 which is defined by the lower boundary of the medium-term ascending channel in place since 28 December 2016 low and also the 23.6% Fibonacci retracement of the up move from 28 December 2016 low to 09 June 2017 high.
Therefore, we maintain the bullish bias and as long as the 25500 medium-term pivotal support holds, the Index is likely to stage another potential upleg to target the next resistances at 26335/400 follow by 26960 next.
However, failure to hold above 25000 may jeopardise the preferred bullish bias to open up scope for a corrective decline towards the next support at 23700/400 (former congestion swing lows area of 09 March/19 April 2017 & the 50% Fibonacci retracement of the on-going up move since 28 December 2016 low).
ASX 200 – Potential bearish tone still prevails below 5805
 (Click to enlarge charts)
Key Levels (1 to 3 weeks)
Intermediate resistance: 5770/90
Pivot (key resistance): 5805/822
Supports: 5688, 5736 & 5615/5580
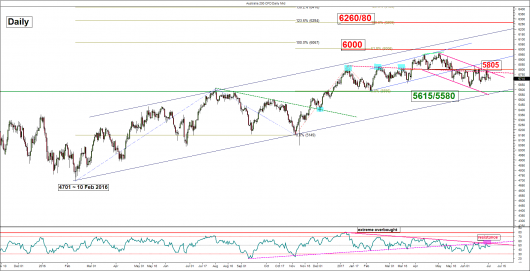
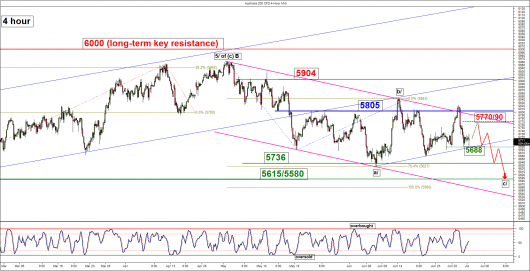
Next resistances: 5904 & 6000
Medium-term (1 to 3 weeks) Outlook
Last week, the Australia 200 Index (proxy for the ASX 200 futures) had a break above the 5740 intermediate resistance but staged a minor bearish reversal of 2.2% at the 5805 medium-term pivotal resistance (an intraday high of 5822 on Thurs, 29 June) to print a low of 5689 on last Fri, 30 June. Click here for a recap on our previous weekly technical outlook.
Current key elements as follow:
- The intermediate support rests at 5688 which is defined by a minor ascending trendline in place since 08 June 2017 low (see 4 hour chart).
- The intermediate resistance stands at the 5770/90 zone which is defined by the 61.8%/76.4% Fibonacci retracement of the recent decline from 29 June 2017 high of 5822 to last Fri, 30 June 2017 low of 5689 (see 4 hour chart).
- The daily RSI oscillator is still capped below a corresponding descending trendline resistance at the 55% level which suggests that medium-term downside momentum of price action remains intact.
- The shorter-term 4 hour Stochastic oscillator has exited from its oversold region and still has room to manoeuvre to the upside before it reaches at extreme overbought level. These observations suggest that the Index may still shape another round of minor rebound above the 5688 intermediate support.
Therefore, failure to have a direct break below 5688 may see a minor corrective rebound first to test the 5770/90 intermediate resistance with a maximum limit set at the 5805/822medium-term pivotal resistance. Thereafter, another potential bearish impulsive downleg is likely to materialise to retest the 08 June 2017 swing low area of 5736 before targeting the next support at 5615/5580.
On the other hand, a clearance above 5822 may invalidate the preferred bearish scenario to see a squeeze up towards the next resistance at 5904 (swing high area of 04 May/11 May 2017).
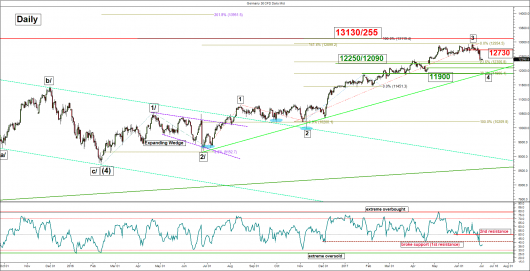
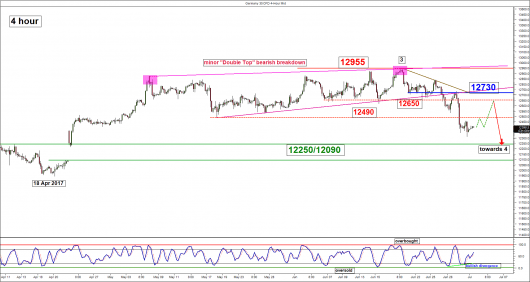
DAX – Potential corrective decline in progress within longer-term uptrend
 (Click to enlarge charts)
Key Levels (1 to 3 weeks)
Intermediate resistances: 12490, 12650
Pivot (key resistance): 12730
Support: 12250/12090
Next resistance: 12955
Medium-term (1 to 3 weeks) Outlook
Last week, the Germany 30 Index (proxy for the DAX futures) had broken below the 12490 medium-term pivotal resistance which invalidated our preferred bullish scenario for a new all-time high.
Current key elements are as follow:
- The daily RSI oscillator has broken below its corresponding support at the 40% level and still has room to manoeuvre to the downside before it reaches at extreme oversold level of 26% since early Feb 2016 that coincides with medium-term swing low of 11 February 2016 seen in the Index. These observations suggest that medium-term downside momentum remains intact.
- The significant medium-term resistance now stands at 12730 which is defined by the pull-back resistance of the minor “Double Top” bearish breakdown and the 61.8% Fibonacci retracement of the prior decline from the 12955 high printed on 20 June 201 7 (see 4 hour chart).
- Based on the Elliot Wave principal/fractal analysis, the Index is likely to have completed the intermediate degree bullish impulsive wave 3 from 03 November 2016 low at its 12955 high seen on 20 June 2017. Current price action is undergoing a potential intermediate degree corrective wave 4 to retrace the afore mentioned wave 3 rally with potential downside targets set at 12250/12090 and 11900 (23.6%/38.2% Fibonacci retracement of the up move from 03 November 2016 low to 20 June 2017 high & the ascending trendline support in place since 24 June 2016/Brexit low).
- The shorter-term 4 hour Stochastic oscillator has flashed a bullish divergence signal and exited from its oversold region. It still has room to manoeuvre to the upside before it reaches an extreme overbought level. These observations suggest a minor corrective rebound may occur for the Index at this juncture.
- The significant medium-term support now rests at the 12250/12090 zone which is also the gap support seen after the outcome of the 1st round of the French presidential election.
Therefore, we have turned bearish on Index for another leg of corrective decline but we cannot rule out a short-term minor corrective rebound at this juncture towards 12650 if it manages to break above 12490. As long as the 12730 medium-term pivotal resistance is not surpassed, the Index is likely to see another round of decline towards the 12250/12090 gap support.
However, a clearance above 12730 may invalidate the bearish scenario to see a choppy upward movement to retest its current all-time high level of 12955.
Charts are from City Index Advantage TraderPro & eSignal
Disclaimer
The material provided herein is general in nature and does not take into account your objectives, financial situation or needs. While every care has been taken in preparing this material, we do not provide any representation or warranty (express or implied) with respect to its completeness or accuracy. This is not an invitation or an offer to invest nor is it a recommendation to buy or sell investments. City Index recommends you to seek independent financial and legal advice before making any financial investment decision. Trading CFDs and FX on margin carries a higher level of risk, and may not be suitable for all investors. The possibility exists that you could lose more than your initial investment further CFD investors do not own or have any rights to the underlying assets. It is important you consider our Financial Services Guide and Product Disclosure Statement (PDS) available at www.cityindex.com.au, before deciding to acquire or hold our products. As a part of our market risk management, we may take the opposite side of your trade. GAIN Capital Australia Pty Ltd (ACN 141 774 727, AFSL 345646) is the CFD issuer and our products are traded off exchange.


