Short-term Technical Outlook (Wed, 26 Apr 2017)
 (Click to enlarge charts)
What happened earlier/yesterday
The U.S. S&P 500 Index (proxy for the S&P 500 futures) has staged a bullish breakout above the 2380 medium-term upper neutrality range as the market waits for U.S. President Trump’s announcement on the principles of his proposed tax reduction plans later today. Current details of the plan are cantered on a massive cut to the corporate tax rate from 35% to 15% but any details on how to fund such tax cuts may not be announced. In addition, Trump is not in favour of the “border adjustment tax” proposed by the House Republicans where U.S. corporations will be taxed on imported goods and no tax on exported goods. One of the main aims of the border adjustment tax is to raise revenue to fund the budget deficit from any tax reduction plans.
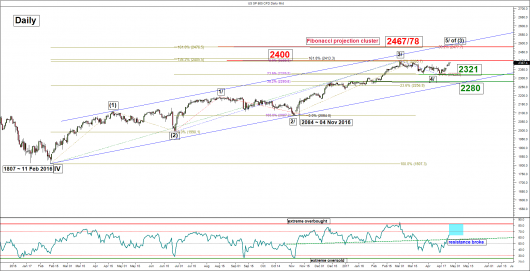
Yesterday’s price action of the Index has invalidated the initial bearish corrective down move towards the 2300/2280 support zone. Click here for a recap on our latest weekly technical outlook published on Monday, 24 April. Right now, it is likely that the Index has reached its corrective down move low of 2321 on 27 March 2017 from the current all-time area of 2400 printed on 01 March 2017. Current price action is in the midst of undergoing a bullish impulsive upleg than may see another new all-time high in the coming weeks.
Key technical elements
- The daily RSI oscillator of the Index has staged a bullish breakout from its corresponding significant resistance and has further room to manoeuvre to the upside before it reaches an extreme overbought level. These observations suggest that medium-term upside momentum of price action has resurfaced.
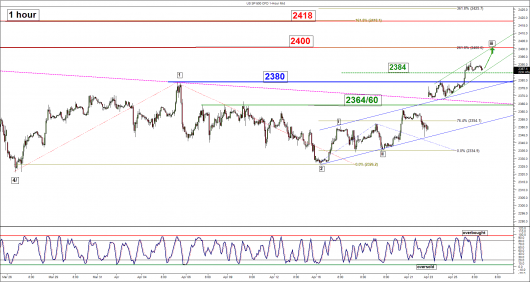
- The intermediate short-term support of the Index rests at 2384 which is defined by the minor ascending channel support in place since 25 April 2017 low.
- The key short-term support rests at 2380 which is defined by the former range top from 21 March to 06 April 2017 and the 23.6% Fibonacci retracement of the recent up move from 17 April 2017 low to yesterday’s (26 Apr) high of 2392.
- The significant near-term resistances stands at 2400 (current all-time high area & the aforementioned minor ascending channel resistance) follow 2418 (1.618 Fibonacci projection of the up move from 27 Mar 2017 low to 06 Apr 2017 high projected from 17 Apr 2017 low – potential minor degree impulsive wave 3 target based on the Elliot Wave Principle)
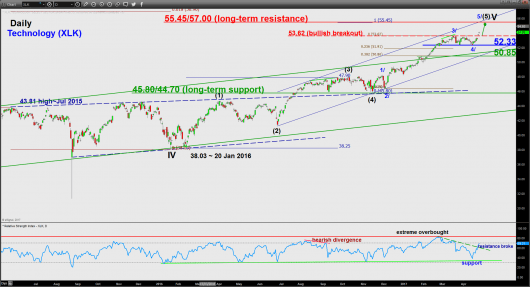
- One the leading sectors, the S&P 500 Technology sector ETF (XLK) that has outperformed the S&P 500 since November 2016 (post U.S. president election) has stage a bullish breakout above its 53.62 medium-term resistance. Its technical elements have turned positive to advocate for a further potential up move to target the 55.45/57.00 key long-term resistance zone above the 52.33 medium-term pivotal support. From a sector rotation analysis, the price movement of the leading S&P 500 Technology sector ETF (XLK) is supporting a further potential up move to materialise in the benchmark S&P 500 (refer to the last chart).
Key levels (1 to 3 days)
Intermediate support: 2384
Pivot (key support): 2380
Resistances: 2400 & 2418
Next support: 2364/60 (medium-term pivot)
Conclusion
As long as the 2380 short-term pivotal support holds, the Index is likely to see a further potential push up to retest the current all-time area of 2400 before targeting a new high of 2418 in the first step.
On the other hand, failure to hold above 2380 may negate the preferred bullish tone to see a deeper slide toward the 2364/60 medium-term pivotal support (former range top of 07 Apr/12 Apr 2017 that has been broken out on Mon, 24 Apr).
Charts are from City Index Advantage TraderPro & eSignal
Disclaimer
The material provided herein is general in nature and does not take into account your objectives, financial situation or needs. While every care has been taken in preparing this material, we do not provide any representation or warranty (express or implied) with respect to its completeness or accuracy. This is not an invitation or an offer to invest nor is it a recommendation to buy or sell investments. City Index recommends you to seek independent financial and legal advice before making any financial investment decision. Trading CFDs and FX on margin carries a higher level of risk, and may not be suitable for all investors. The possibility exists that you could lose more than your initial investment further CFD investors do not own or have any rights to the underlying assets. It is important you consider our Financial Services Guide and Product Disclosure Statement (PDS) available at www.cityindex.com.au, before deciding to acquire or hold our products. As a part of our market risk management, we may take the opposite side of your trade. GAIN Capital Australia Pty Ltd (ACN 141 774 727, AFSL 345646) is the CFD issuer and our products are traded off exchange.


