sp 500 cautious on the recent rally 2692862017
Short-term Technical Outlook (Wed, 24 May 2017) (Click to enlarge charts) What happened earlier/yesterday Despite all the negative typical “risk –off” events that sprouted out […]
Short-term Technical Outlook (Wed, 24 May 2017) (Click to enlarge charts) What happened earlier/yesterday Despite all the negative typical “risk –off” events that sprouted out […]


(Click to enlarge charts)
Despite all the negative typical “risk –off” events that sprouted out since Monday, 22 May 2017 such as the test firing of another ballistic missile from North Korea on Sunday, the tragic terrorist attack that occurred in Manchester, U.K and the today’s downgrade of China’s sovereign debt ratings from Moody’s to A1 from Aa3 due to rising financial risks from an increasing debt burden caused by previous credit-fueled stimulus (this is the first time in 30 years that China got a credit downgrade), the S&P 500 Index (proxy for the S&P 500 futures) had continued to inch higher and recovered the losses inflicted by U.S. President Trump’s political saga.
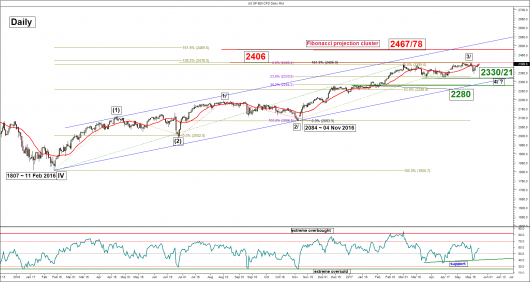
Yesterday’s close of the Index at 2398 had marked three consecutive higher closes since 18 May 2017 and surpassed our 2395 medium-term pivotal resistance set for this week. However, we are quite reluctant to turn outright bullish at this juncture due to the following technical elements.
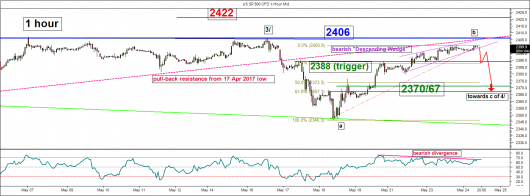
Pivot (key resistance): 2406
Supports: 2388 & 2370/67 (50%/61.8% Fib retracement of the up move from 18 May 2017 low)
Next resistance: 2422 (1.00 Fib projection of the up move from 18 May low to 20 May 2017 high)
Therefore, we maintain the bearish bias and tolerate the excess to 2409 but the Index needs to break below 2388 to open up scope for a potential corrective decline to target the 2370/67 support zone in the first step.
On the other hand, a clearance above 2409 is likely to invalidate the bearish bias and kick-start another upleg towards 2422 next in the short-term.
Charts are from City Index Advantage TraderPro & IndexIndicators.com
Disclaimer
The material provided herein is general in nature and does not take into account your objectives, financial situation or needs. While every care has been taken in preparing this material, we do not provide any representation or warranty (express or implied) with respect to its completeness or accuracy. This is not an invitation or an offer to invest nor is it a recommendation to buy or sell investments. City Index recommends you to seek independent financial and legal advice before making any financial investment decision. Trading CFDs and FX on margin carries a higher level of risk, and may not be suitable for all investors. The possibility exists that you could lose more than your initial investment further CFD investors do not own or have any rights to the underlying assets. It is important you consider our Financial Services Guide and Product Disclosure Statement (PDS) available at www.cityindex.com.au, before deciding to acquire or hold our products. As a part of our market risk management, we may take the opposite side of your trade. GAIN Capital Australia