Medium-term technical outlook on DBS (SGX: D05)

 (Click to enlarge charts)
Key technical elements
- The medium-term uptrend in place since 29 December 2016 low remains intact for DBS (see weekly chart).
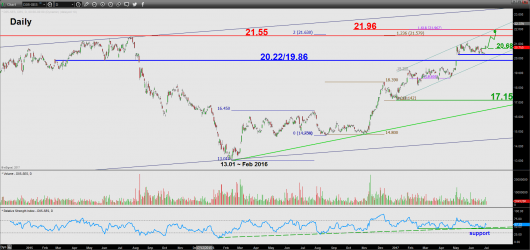
- The recent 4.4 % pull-back from its 21.18 high of 25 May 2015 has managed to stall right at the gap support formed on 02 May/03 May 2017, close to the lower boundary of a medium-term ascending channel from 03 January 2017 low.
- In addition, the daily RSI oscillator has managed to stage a rebound at its corresponding supports at the 43% level. This observation suggests that medium-term upside momentum of price action remains intact and DBS is likely to resume its bullish impulsive upleg within a medium-term uptrend.
- The next significant medium-term resistances stands at 21.155 and 21.96 which is defined by the swing high area of May 2007, a Fibonacci projection cluster and the upper boundary of the aforementioned ascending channel from 03 January 2017 low (see daily & weekly charts).
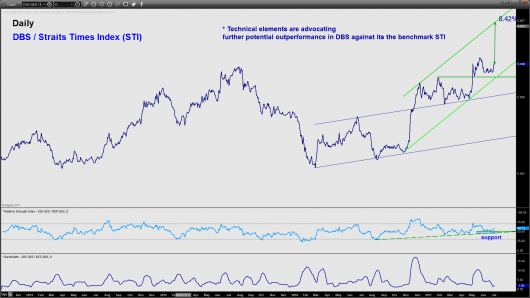
- Relative strength chart analysis suggest that DBS is likely to continue to outperform the benchmark Straits Times Index (STI) by around 8% (refer to the last chart).
Key levels (1 to 3 months)
Intermediate support: 20.68
Pivot (key support): 20.22/19.86
Resistances: 21.55 & 21.96
Next support: 17.15
Conclusion
DBS is now likely to resume its bullish impulsive upleg within its medium-term uptrend in place since 29 December 2016 low. As long as the 20.22/19.86 medium-term pivotal support holds, DBS has the potential to stage a further upmove to target the next resistances at 21.55 follow by 21.96 next
On the other hand, failure to hold above 19.86 is likely to invalidate the medium-term uptrend to open up to scope for a corrective decline towards the next support at 17.15 (50% Fibonacci retracement of the primary uptrend from February 2016 low & close to the major ascending trendline support from February 2016 low).
Charts are from eSignal
Disclaimer
The material provided herein is general in nature and does not take into account your objectives, financial situation or needs. While every care has been taken in preparing this material, we do not provide any representation or warranty (express or implied) with respect to its completeness or accuracy. This is not an invitation or an offer to invest nor is it a recommendation to buy or sell investments. City Index recommends you to seek independent financial and legal advice before making any financial investment decision. Trading CFDs and FX on margin carries a higher level of risk, and may not be suitable for all investors. The possibility exists that you could lose more than your initial investment further CFD investors do not own or have any rights to the underlying assets. It is important you consider our Financial Services Guide and Product Disclosure Statement (PDS) available at www.cityindex.com.au, before deciding to acquire or hold our products. As a part of our market risk management, we may take the opposite side of your trade. GAIN Capital Australia Pty Ltd (ACN 141 774 727, AFSL 345646) is the CFD issuer and our products are traded off exchange.


