Short-term Technical Outlook (Wed, 01 Mar 2017)

 (Click to enlarge chart)
What happened earlier/yesterday
In today’s Asian session (01 March), the Japan 225 Index (proxy for the Nikkei 225 futures) has failed to stage a bearish breakout below the 18990 ascending trendline support from 17 January 2017. It printed a low of 19018 in yesterday’s U.S. session and started to reverse upwards assisted by a renewed strength seen in the USD/JPY.
The sudden surge in the USD/JPY In the yesterday’s late U.S. session has been triggered by hawkish comments on the trajectory of future policy interest rate hikes from two Fed officials; Williams and Bullard which have echoed similar views with Fed Chairwoman Yellen and other officials heard over in the past two weeks. These set of latest comments have increased the probability of a 25bps hike in the fed funds rate to 52% from around 30% seen in a week ago as indicated from the fed funds futures market for the upcoming FOMC meeting in 15 March 2017.
The bullishness seen in USD/JPY has enabled the Nikkei 225 to be the best performing major benchmark index today in the Asian region as it rallied by 1.44% despite the lack of details of U.S President Trump’s proposed tax reforms and infrastructure spending polices in his State of The Union speech to U.S. Congress earlier. The recent record breaking rallies seen in the U.S. benchmark stock indices have been supported by U.S President Trump’s promises of “bold” and “big” initiatives on tax reforms and infrastructure spending policies.
Let us now examine the latest technical elements
Key technical elements
- The USD/JPY is now right at the intermediate pull-back resistance of a former ascending trendline support from 07 February 2017 low at 113.70. The 113.70 resistance also confluences with the swing high area of 21 February 2017 and the 61.8% Fibonacci retracement of the recent decline from 15 February 2017 high of 114.95 to yesterday’s U.S. session low of 111.69. In addition, the 4 hour Stochastic oscillator has reached an extreme overbought level which suggests limited upside potential for USD/JPY at this juncture.
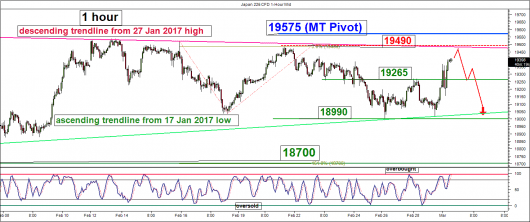
- Despite the rally seen in today’s Asian session, the Japan 225 Index is now coming close to its intermediate range resistance at 19490 which is slightly below the 19575 medium-term pivotal resistance as per highlighted in our medium-term technical view (click here for a recap).
- The hourly Stochastic oscillator of the Index has now reached an extreme overbought level which suggests a potential mean reversion downside move in price action.
Key levels (1 to 3 days)
Intermediate resistance: 19490
Pivot (key resistance): 19575 (medium-term pivot)
Supports: 19265 & 18990
Next resistances: 19860 & 20000
Conclusion
Given USD/JPY’s direct correlation with the Nikkei 225, the USD/JPY must not break above the 113.70 resistance in order for the Nikkei 225 to see a potential mean reversion downside move towards 19256 before targeting the range support of 18990.
On the other hand, a clearance above 19575 medium-term pivotal resistance is likely to trigger the start of a new upleg for the Nikkei 225 towards the next resistance at 19860 in the first step.
Charts are from City Index Advantage TraderPro
Disclaimer
The material provided herein is general in nature and does not take into account your objectives, financial situation or needs. While every care has been taken in preparing this material, we do not provide any representation or warranty (express or implied) with respect to its completeness or accuracy. This is not an invitation or an offer to invest nor is it a recommendation to buy or sell investments. City Index recommends you to seek independent financial and legal advice before making any financial investment decision. Trading CFDs and FX on margin carries a higher level of risk, and may not be suitable for all investors. The possibility exists that you could lose more than your initial investment further CFD investors do not own or have any rights to the underlying assets. It is important you consider our Financial Services Guide and Product Disclosure Statement (PDS) available at www.cityindex.com.au, before deciding to acquire or hold our products. As a part of our market risk management, we may take the opposite side of your trade. GAIN Capital Australia Pty Ltd (ACN 141 774 727, AFSL 345646) is the CFD issuer and our products are traded off exchange.


