Short-term Technical Outlook (Thurs, 23 Mar 2017)
 (Click to enlarge charts)
What happened earlier/yesterday
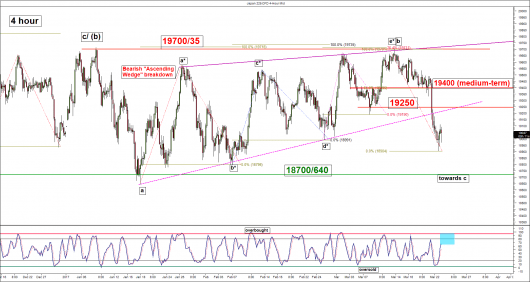
The Japan 225 Index (proxy for the Nikkei 225 futures) has tumbled as expected towards the 19260/190 short-term downside target but it broke below the “Ascending Wedge” support and the 19090 medium-term pivotal support. Therefore, the preferred medium-term (1 to 3 weeks) “last push up” scenario towards the 19700/735 range top has been invalidated. Click here for a recap on our weekly technical outlook published on Mon, 20 Mar 2017.
What is in store now for the Nikkei 225?
Key technical elements
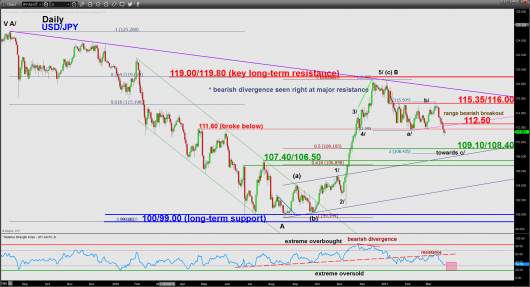
- Based on intermarket analysis, the USD/JPY has also staged a bearish breakout from the 111.60 range support in place since the start of February 2017 and shows further downside potential towards the 109.10/108.40 medium-term support below the 112.50 key medium-term resistance. Given its direct correlation with the Nikkei 225 (via exports), further downside potential in the USD/JPY will reinforce further weakness in the Nikkei 225 (refer to the 1st chart).
- The Index has staged a bearish breakdown below its “Ascending Wedge” support now turns pull-back resistance at 19250.
- The 4 hour Stochastic oscillator has continued to inch upwards and still has room to manoeuvre to the upside before it reaches an extreme overbought level. Given yesterday’s steep decline through the break below 19260/190, the Index now faces the risk of a minor rebound at this juncture.
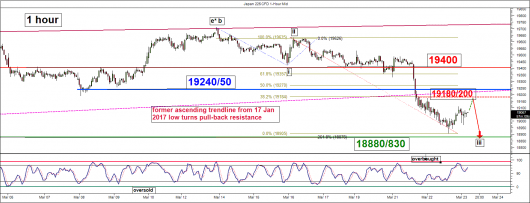
- Based on the Elliot Wave Principal and fractal analysis, the Index is now likely undergoing a five wave bearish impulsive down move from the 19700 range top (14 March 2017 high) of a minor degree (i, ii, iii, iv & v). Current price action is still undergoing the potential wave iii decline with end target at 18880/830 which also confluences with the minor swing low area of 31 January/07 February 2017 (see 1 hour chart).
- The key short-term resistance now stands at 19250 which is defined by the former minor swing low area of 08 March 2017 and close to the 50% Fibonacci retracement of current steep decline from 16 March 2017 high of 19626 to yesterday’s U.S. session low of 18906.
Key levels (1 to 3 days)
Intermediate resistance: 19180/200
Pivot (key resistance): 19250
Support: 18880/830
Next resistance: 19400 (medium-term)
Conclusion
The Index may now see a short-term relief rebound towards 19180/200 with a maximum limit set at the 19250 short-term pivotal resistance before another potential downleg materialises to target the next support at 18880/830.
However, a break above 19250 is likely to negate the preferred bearish tone to see a push up to test the updated medium-term pivotal resistance at 19400.
Charts are from City Index Advantage TraderPro & eSignal
Disclaimer
The material provided herein is general in nature and does not take into account your objectives, financial situation or needs. While every care has been taken in preparing this material, we do not provide any representation or warranty (express or implied) with respect to its completeness or accuracy. This is not an invitation or an offer to invest nor is it a recommendation to buy or sell investments. City Index recommends you to seek independent financial and legal advice before making any financial investment decision. Trading CFDs and FX on margin carries a higher level of risk, and may not be suitable for all investors. The possibility exists that you could lose more than your initial investment further CFD investors do not own or have any rights to the underlying assets. It is important you consider our Financial Services Guide and Product Disclosure Statement (PDS) available at www.cityindex.com.au, before deciding to acquire or hold our products. As a part of our market risk management, we may take the opposite side of your trade. GAIN Capital Australia Pty Ltd (ACN 141 774 727, AFSL 345646) is the CFD issuer and our products are traded off exchange.


