Short-term Technical Outlook (Tues, 07 Mar 2017)
 (Click to enlarge chart)
What happened earlier/yesterday
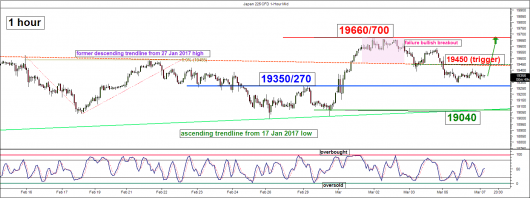
The Japan 225 Index (proxy for the Nikkei 225 futures) has not managed to get a positive follow through since its bullish breakout (triggered by U.S President Trump’s State of The Union speech) from the minor descending trendline from 27 January 2017 high. Yesterday, the Index has reintegrated back below the 19450 pull-back support.
Key technical elements
- Despite yesterday’s decline, the Index is still hovering above a key short-term support zone at 19350/270 which also confluences with a Fibonacci cluster (61.8% retracement of the up move from 01 March 2017 low of 19018 & 1.00 projection of the down move from 02 March 2017 high of 19668).
- The hourly Stochastic oscillator has started to inch upwards from its oversold zone and still has room to manoeuvre to the upside before it reaches an extreme overbought level. This observation suggests a revival of short-term upside momentum of price action.
Key levels (1 to 3 days)
Pivot (key support): 19350/270
Resistances: 19450 & 19660/700
Next support: 19040
Conclusion
Even though the Index is still above its 19350/270 short-term pivotal support, conviction is low to advocate for a potential push up to retest its intermediate range top/resistance at 19660/700. In order to revive the bullish tone, price action needs to break above 19450.
On the other hand, failure to hold above 19270 is likely to open up scope for a further slide to retest the ascending trendline support from 17 January 2017 low now at 19040. Charts are from City Index Advantage TraderPro
Disclaimer
The material provided herein is general in nature and does not take into account your objectives, financial situation or needs. While every care has been taken in preparing this material, we do not provide any representation or warranty (express or implied) with respect to its completeness or accuracy. This is not an invitation or an offer to invest nor is it a recommendation to buy or sell investments. City Index recommends you to seek independent financial and legal advice before making any financial investment decision. Trading CFDs and FX on margin carries a higher level of risk, and may not be suitable for all investors. The possibility exists that you could lose more than your initial investment further CFD investors do not own or have any rights to the underlying assets. It is important you consider our Financial Services Guide and Product Disclosure Statement (PDS) available at www.cityindex.com.au, before deciding to acquire or hold our products. As a part of our market risk management, we may take the opposite side of your trade. GAIN Capital Australia Pty Ltd (ACN 141 774 727, AFSL 345646) is the CFD issuer and our products are traded off exchange.


