Short-term Technical Outlook (Tues, 13 Jun 2017)

 (Click to enlarge charts)
What happened earlier/yesterday
Yesterday, 12 June, the Hang Seng Index (proxy for Hang Seng Index futures) had tumbled by close to 1.3% which recorded its largest decline since 19 April 2017 low. Tencent, a key component stock that has the highest weightage of 10% was the major contributed of the decline as it declined by 2.4%.
Interestingly, Tencent is a high flying technology stock that outperformed the Hang Seng Index (HSI) by a wide margin where it soared by close to 50% versus a gain of 17% seen in the HSI since 03 Jan 2017. This phenomenon is similar the carnage seen in the tech heavy U.S. Nasdaq 100 Index where its fall seen last Friday, 09 June had been contributed mainly by just five high flying stocks; Apple, Facebook, Amazon, Alphabet (Google) and Microsoft. Therefore, we are experiencing profit-taking in “momentum chasing play” in U.S. technology stocks that has caused a negative feedback loop into similar “momentum chasing tech stock plays” in other parts of the world.
Key technical elements
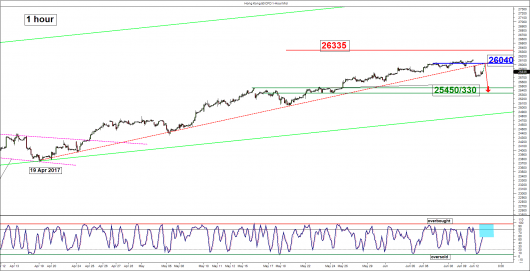
- The HSI has failed to break above 26120/170 risk level as per highlighted in our previous weekly technical out (click here for a recap) and staged a bearish breakdown below a minor ascending trendline from 19 April 2017 low (see 1 hour chart).
- The former ascending trendline support is now acting as a pull-back resistance at 26040 which also confluences with the gap resistance and the 76.4% Fibonacci retracement of the recent minor decline from last Fri, 09 June high to yesterday low of 255741 (see 1 hour chart).
- The next significant short-term support rests at the 25450/330 zone which is defined by the minor congestion area from 15 May to 23 May 2017(see 1 hour chart).
- The medium-term uptrend of the HSI remains intact as it continues to evolve within a bullish ascending channel in place since 28 December 2016 low (see daily chart).
- The hourly Stochastic oscillator has continued to inch upwards and still has some room left for further potential upside before it reaches at extreme overbought level (depicted by the blue box seen in the 1 hour chart). This observation suggests that the Index is still in the midst of undergoing a potential minor corrective rebound to retrace yesterday’s steep decline.
Key Levels (1 to 3 days)
Pivot (key resistance): 26040
Support: 25450/330
Next resistance: 26335
Conclusion
The Index is likely to be in a short-term corrective mean reversion decline phase within a medium-term uptrend in place since 28 December 2016 low. Right now, it may continue to stage a further push up towards the 26040 short-term pivotal resistance before another potential downleg materialises to target the next support at 25450/330 in the first step.
However, a clearance above 26040 is likely to invalidated the preferred short-term mean reversion decline scenario to open up scope for a continuation of the up move towards the next resistance at 26335.
Charts are from City Index Advantage TraderPro
Disclaimer
The material provided herein is general in nature and does not take into account your objectives, financial situation or needs. While every care has been taken in preparing this material, we do not provide any representation or warranty (express or implied) with respect to its completeness or accuracy. This is not an invitation or an offer to invest nor is it a recommendation to buy or sell investments. City Index recommends you to seek independent financial and legal advice before making any financial investment decision. Trading CFDs and FX on margin carries a higher level of risk, and may not be suitable for all investors. The possibility exists that you could lose more than your initial investment further CFD investors do not own or have any rights to the underlying assets. It is important you consider our Financial Services Guide and Product Disclosure Statement (PDS) available at www.cityindex.com.au, before deciding to acquire or hold our products. As a part of our market risk management, we may take the opposite side of your trade. GAIN Capital Australia Pty Ltd (ACN 141 774 727, AFSL 345646) is the CFD issuer and our products are traded off exchange.


