Short-term Technical Outlook (Fri, 21 Apr 2017)

 (Click to enlarge charts)
What happened earlier/yesterday
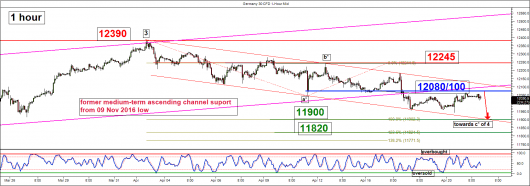
The Germany 30 Index (proxy for the DAX futures) has continued to trade sideways since bearish breakdown of its former medium-term ascending channel support that occurred on Tuesday, 18 April 2017.
The upcoming major risk event will be the 1st round of the French presidential election on Sunday, 23 April 2017 where the first exit polls from French media are expected to published at around 8p.m (Sunday) Paris time.
Latest opinion polls compiled by Financial Times as at 20 April had indicated Macron (centrist, pro-business) with a lead of 24% with Le Pen (far-right, anti-Euro) remained at second place at 22%. However, Macron led over Le Pen had widened to 2% from % earlier. Rising dark horse, Melenchon (far-left, anti-austerity) had a share of 19% which can upset Le Pen to take second place. Thus, key European stock markets such as DAX had managed to see a minor rebound to retrace close to 50% of the recent losses from 18 April 2017 high to 20 April 2017 low where there is a growing possibility that “hard-core anti- Euro” sceptic Le Pen may be kicked out of the 1st round.
Now, let’s take a look at its latest technical elements
Key technical elements
- Despite yesterday’s minor rebound in price action of the Index, it is being capped by a significant short-term resistance of 12080/100 which is defined by a confluence of elements. The pull-back resistance of the former medium-term ascending channel support in place since 07 February 2017 low, minor descending channel resistance in place since 03 April 2017 high and the former minor swing low areas of 11 April/14 April 2017.
- The daily RSI oscillator has also staged a similar bearish breakdown of its corresponding ascending trendline support from November 2016 low. Prior to the bearish breakdown of its support, the daily RSI has flashed a bearish divergence signal at its overbought region. These observations suggest that medium-term downside momentum of price action has resurfaced.
- The next significant short-term support rests at 11900/820 which is defined by the congestion area of 25 January swing high to 22 March 2017 swing low and the 23.6% Fibonacci retracement of the rally from 09 November 2016 low to 03 April 2017 high.
- The next support rests at 11465/30 which is defined by the former 30 November 2015 medium-term swing high area and the 38.2% Fibonacci retracement of the rally from 09 November 2016 low to 03 April 2017 high.
Key levels (1 to 3 days)
Pivot (key resistance): 12080/100
Supports: 11900/820 & 11465/30
Next resistances: 12245 & 12390
Conclusion
As long as the 12080/100 short-term pivotal resistance is not surpassed, the Index may still see a further potential downside pressure to target the 11900/11820 support. Only a break below 11820 is likely to open up scope for a deeper decline towards the next support at 11465/30.
On the other hand, a clearance above 12100 is likely to negate the preferred bearish bias to trigger a further corrective rebound towards the next resistance at 12245 (close to 61.8% Fibonacci retracement of the decline from 03 April 2017 high to 20 April 2017 low & the minor swing high areas of 06 April/12 April 2017).
Charts are from City Index Advantage TraderPro
Disclaimer
The material provided herein is general in nature and does not take into account your objectives, financial situation or needs. While every care has been taken in preparing this material, we do not provide any representation or warranty (express or implied) with respect to its completeness or accuracy. This is not an invitation or an offer to invest nor is it a recommendation to buy or sell investments. City Index recommends you to seek independent financial and legal advice before making any financial investment decision. Trading CFDs and FX on margin carries a higher level of risk, and may not be suitable for all investors. The possibility exists that you could lose more than your initial investment further CFD investors do not own or have any rights to the underlying assets. It is important you consider our Financial Services Guide and Product Disclosure Statement (PDS) available at www.cityindex.com.au, before deciding to acquire or hold our products. As a part of our market risk management, we may take the opposite side of your trade. GAIN Capital Australia Pty Ltd (ACN 141 774 727, AFSL 345646) is the CFD issuer and our products are traded off exchange.


