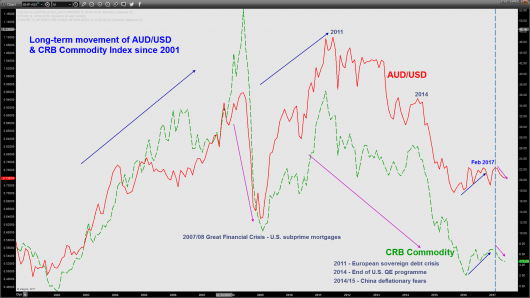
audusd further potential downside as rba q1 gdp looms 2693192017
*Note: The medium-term technical analysis outlook section that had been published earlier on Friday, 02 June 2016 (before U.S. Nonfarm payrolls data for May) was […]
*Note: The medium-term technical analysis outlook section that had been published earlier on Friday, 02 June 2016 (before U.S. Nonfarm payrolls data for May) was […]
*Note: The medium-term technical analysis outlook section that had been published earlier on Friday, 02 June 2016 (before U.S. Nonfarm payrolls data for May) was updated to take into account of the bullish break of the former 0.7423 pivotal resistance.
Next week, we will have two major economic events for Australia; RBA (Australian central bank) monetary policy meeting outcome on Tues, 06 June at 0430 GMT follow by Q1 2017 GDP on Wed, 07 Jun at 0130 GMT.
In the last monetary policy meeting, RBA had left its policy cash rate at a record low of 1.5% since August 2016 as expected. In its accompanying monetary policy statement, RBA had turned more optimistic on the labour market after a better than expected employment report for April that rounded off seven consecutive months of increases.
For the upcoming meeting on Tues, 06 June, the ASX 30 day interbank cash rate future has priced in a 98% probability that the policy cash rate will remain at 1.5% and only a 2% chance of a rate cut by 25 basis points as at 31 May 2017 futures pricing data.
Also, the household debt to income ratio is at a record high which makes RBA reluctant to cut rate further at this juncture just to boast growth in the near-term that will lead to a further rise in household borrowings and also increases the risk of creating a housing bubble. Therefore, we are expecting RBA to remain status quo and keep its policy cash rate unchanged at 1.5%.
The accompanying monetary policy statement will be the key driver that can influence the movement of the AUD at least in the short to medium-term. There are several risk factors that can cause the RBA to strike a cautionary tone on the future economic outlook as follow:
Therefore, if such risk factors are being highlighted in the monetary policy statement, it can reinforce the on-going downside movement seen in the AUD/USD seen since 25 May 2017. In addition, we may also see a slowdown in Q1 GDP q/q growth from a 1.1% q/q growth recorded in Q4 2016 due to the risk factors highlighted above that can caused a drag on consumption and net trade.

Intermediate resistance: 0.7516
Pivot (key resistance): 0.7550/60
Supports: 0.7375 (downside trigger), 0.7330 & 0.7280/60
Next resistances: 0.7740/50
In the shorter-term (1 to 3 days), the AUD/USD may see a further push up to retest the recent minor swing high area of 0.7516 printed on 23/25 May 2017 with a maximum limit set at the 0.7550/60 updated medium-term pivotal resistance.
Thereafter, based on the Elliot Wave Principal/fractal analysis, a potential downside mean reversion movement is likely to occur for the pair to seek a retest on 0.7375 (lower boundary of the short-term ascending range channel). Only a break below 0.7375 may open up scope and increase the conviction to see a medium-term (1 to 3 weeks) bearish impulsive down leg to retest 0.7330 before targeting the 0.7280/60 support.
On the other hand, a clearance above 0.7550/60 is likely to see a further squeeze up towards a longer-term significant resistance at 0.7440/50 (the range top that has capped all the up moves since mid-April 2016).
Charts are from eSignal
Disclaimer
The material provided herein is general in nature and does not take into account your objectives, financial situation or needs. While every care has been taken in preparing this material, we do not provide any representation or warranty (express or implied) with respect to its completeness or accuracy. This is not an invitation or an offer to invest nor is it a recommendation to buy or sell investments. City Index recommends you to seek independent financial and legal advice before making any financial investment decision. Trading CFDs and FX on margin carries a higher level of risk, and may not be suitable for all investors. The possibility exists that you could lose more than your initial investment further CFD investors do not own or have any rights to the underlying assets. It is important you consider our Financial Services Guide and Product Disclosure Statement (PDS) available at www.cityindex.com.au, before deciding to acquire or hold our products. As a part of our market risk management, we may take the opposite side of your trade. GAIN Capital Australia Pty Ltd (ACN 141 774 727, AFSL 345646) is the CFD issuer and our products are traded off exchange.