Since our last analysis dated on 07 April 2017 (U.S nonfarm payrolls), the AUD/USD had staged the initial drop and rallied towards the expected short-term upside target/resistance at 0.7575/85. Click here for a recap on our previous report.
Today (13 April) sharp up move seen in the AUD/USD can be attributed by two fundamental events; U.S. President’s Trump impromptu remarks during an interview session yesterday with The Wall Street Journal which he stated recent U.S. dollar strength will hurt the competitiveness of U.S. firms that have overseas business operations and he favoured a “low” interest rate environment.
Secondly, the latest Australian job data had appeared to be rosier than expected where the Employment Change for March recorded an increase in 60.9K versus a consensus reading of 20K. Even February’s initial decline of 6.4K was revised up to show an increase of 2.8K. The latest March job numbers was the largest since September 2015 and its sixth consecutive month of increases. These latest set of positive Australian job data will likely put RBA back in a neutral stance on its monetary policy after a “slightly dovish” monetary statement on 04 April 2017 that highlighted its concerns on sluggish wage growth.
The next economic data release that can have an impact on AUD/USD will be several key China data out on next Monday, 17 April as follow:
- Q1 GDP (consensus set at 1.6% q/q & 6.8% y/y)
- Fixed Asset Investment for Mar (consensus set at 8.8% y/y, 8.9% y/y seen in Feb)
- Industrial Production for Mar (consensus set at 6.3% y/y , 6.3% y/y seen in Feb)
- Retails Sales for Mar (consensus set at 9.6% y/y, 9.5% y/y seen in Feb)
In the recent key “Two Sessions” meeting speech on 03 March 2017, China Premier Li Keqiang has disclosed the central government is now aiming for 2017 GDP growth to be around 6.5%, slightly lower than last year’s target of 6.5% to 7% and the actual full-year 2016 GDP growth of 6.7% which was the weakest pace in 26 years.
Top Chinese economic planners have also signalled tolerance for slower and moderate growth this year (a reversal of last year’s expansionary fiscal policies) to help balance out/diffuse financial risks created by an explosive growth in debt especially in the housing market.
Since the start of 2017, the Chinese central bank, PBOC is also singing the same tune by raising short-term interest rates on several occasions that has caused the three month interbank rate to remain above 3.5% since January 2017.
These combinations of a slow withdrawal of fiscal policies and tightening liquidity conditions have spilled over to the “speculative” financial markets where the benchmark Iron Ore spot price has fallen by 28% from its multi-year high of $94.86 per tonne seen in February 2017 to a current intraday low of $68.04 on 13 April 2017 based on Metal Bulletin data. Iron Ore has entered into a bear market territory where it can create a negative feedback loop back into “hard” economic data such as Industrial Production. Some plausible negative signs can already been seen in the latest Caxin Manufacturing PMI for March where it decline to 51.2 from 51.7 recorded in February and came in below market consensus of 51.5. In addition, the Caxin Services PMI for March also fell to 52.2 from 52.6 in February and below market consensus of 53.2. It was the lowest reading since September 2016.
Given the on-going battle orchestrated by the central government to control the “red-hot” housing market and current liquidity tightening stance adopted by PBOC is likely to have also reduced consumer confidence and capped retail sales spending. Therefore, Industrial Production and Retail Sales may come in below expectation that can put a cap on the current strength seen in the AUD/USD.
Now, let’s us take a look at the latest technical elements on AUD/USD
Short-term technical outlook on AUD/USD
 (Click to enlarge chart)
Key technical elements
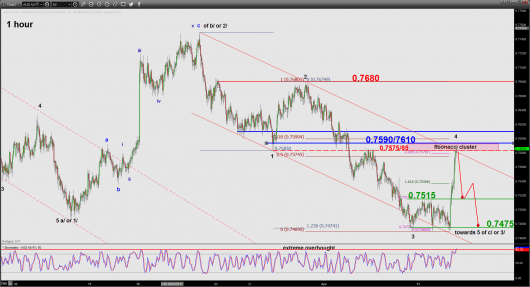
- The rally from the 0.7475 swing low area of 13 April 2017 is now right at the upper boundary of the short-term bearish descending channel in place since 21 March 2017 at 0.7590 which also confluences with the former minor swing low area of 28 March 2017 and a Fibonacci cluster
- Based on the Elliot Wave Principal and fractal analysis, the recent up move from last Friday, 07 April 2017 low (Post NFP) is likely a minor degree corrective wave 4 with potential end target at 0.7575/7585 and thereafter, another minor degree down move wave 5 may kick start at this juncture.
- The hourly Stochastic oscillator has reached an extreme overbought level which suggests that the current upside momentum of price action is overstretched where a potential bearish setback may occur soon.
- The significant short-term support now rests at 0.7515 and 0.7475.
Key levels (1 to 3 days)
Pivot (key resistance): 0.7590/0.7610
Supports: 0.7515 & 0.7475
Next resistance: 0.7680
Conclusion
As long as the 0.7590/0.7610 pivotal resistance is not surpassed, the AUD/USD may see a bearish reaction to retest the supports at 0.7515 follow by 0.7475.
However, a clearance above 0.7610 is likely to see the continuation of the corrective up move to target the next resistance at 0.7680.
Charts are from eSignal
Disclaimer
The material provided herein is general in nature and does not take into account your objectives, financial situation or needs. While every care has been taken in preparing this material, we do not provide any representation or warranty (express or implied) with respect to its completeness or accuracy. This is not an invitation or an offer to invest nor is it a recommendation to buy or sell investments. City Index recommends you to seek independent financial and legal advice before making any financial investment decision. Trading CFDs and FX on margin carries a higher level of risk, and may not be suitable for all investors. The possibility exists that you could lose more than your initial investment further CFD investors do not own or have any rights to the underlying assets. It is important you consider our Financial Services Guide and Product Disclosure Statement (PDS) available at www.cityindex.com.au, before deciding to acquire or hold our products. As a part of our market risk management, we may take the opposite side of your trade. GAIN Capital Australia Pty Ltd (ACN 141 774 727, AFSL 345646) is the CFD issuer and our products are traded off exchange.


