


Q2 2024 Bitcoin Outlook: Reasons for Retreat Before Recovery
Bitcoin Key Points
- Bitcoin surged nearly 75% to new record highs near $73K in Q1, bolstered by 11-figure inflows into US ETFs.
- The historical cycle points to the potential for a 30-50% mid-bull market drawdown around the halving, potentially driven by an Ethereum ETF denial or tighter-than-expected monetary policy.
- Bitcoin will remain in a longer-term bullish trend as long as it holds above its 50-week EMA.
Bitcoin Q1 2024 in Review
Our full year 2024 Bitcoin Outlook article was titled “Is Bitcoin Revving Up for Another Big Bull Market?”, but even I didn’t fully appreciate the potential for the huge rally we ultimately saw in the first quarter. After starting the year near $42,000, the cryptocurrency surged nearly 75% to a record high near $73,000 before pulling back to the low-$60,000s as of writing in late March.
While long-term themes like risk appetite and record levels of fiat debt no doubt played a role, the biggest driver of Bitcoin’s Q1 ascent was one we outlined three months ago: inflows into the newly-approved Bitcoin ETFs in the US. As we noted then, “unlike past high-profile, derivative-based Bitcoin product launches, like futures contracts or futures-based ETFs, spot ETFs [are] required to buy and hold underlying Bitcoin equal to their underlying assets, fundamentally altering the supply-demand balance” and with flows into those ETFs topping a staggering $12B in just 10 weeks, it’s clear that there is strong demand for Bitcoin as an asset class and investment vehicle.
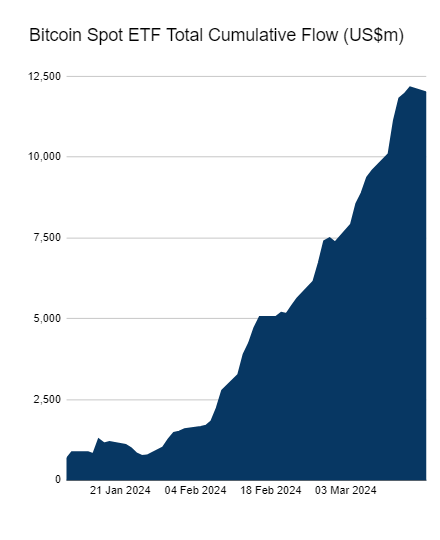
Source: Farside Investors
Bitcoin Q2 2024 Outlook: The Case for a Mid-Bull Market Drawdown
So, what’s the outlook for Bitcoin and other cryptoassets heading into the second quarter?
Without putting too fine of a point on it, it’s perhaps less optimistic than it was at the beginning of the year, with the potential for the type of bull market pullback that we often see around the quadrennial Bitcoin “halving” of new supply, which is currently projected on April 19th.
For the uninitiated, the Bitcoin halving is when the reward for mining new bitcoins is cut in half. This reduces the rate at which new bitcoins are created and thus, lowers the total supply of new bitcoins coming into the market. The halving tends to increase scarcity and historically has led to an increase in the price of bitcoin, though of course it's not guaranteed to do so in the future. As any Bitcoin bull will tell you, the 2024 halving will take the “inflation rate” of Bitcoin’s supply to below 1% per year, less than half of gold’s annual inflation rate.
Looking at my favorite chart, which I colloquially call “The Only Bitcoin Chart You'll Ever Need™”, previous Bitcoin halvings have marked the transition from the yellow post-bottom recovery rally stage to the green, full-blown bull market stage. That said, we have seen meaningful 40-60% drops around the last two halving events, and with sentiment running high ahead of this year’s halving, another such drawdown could be on the cards:
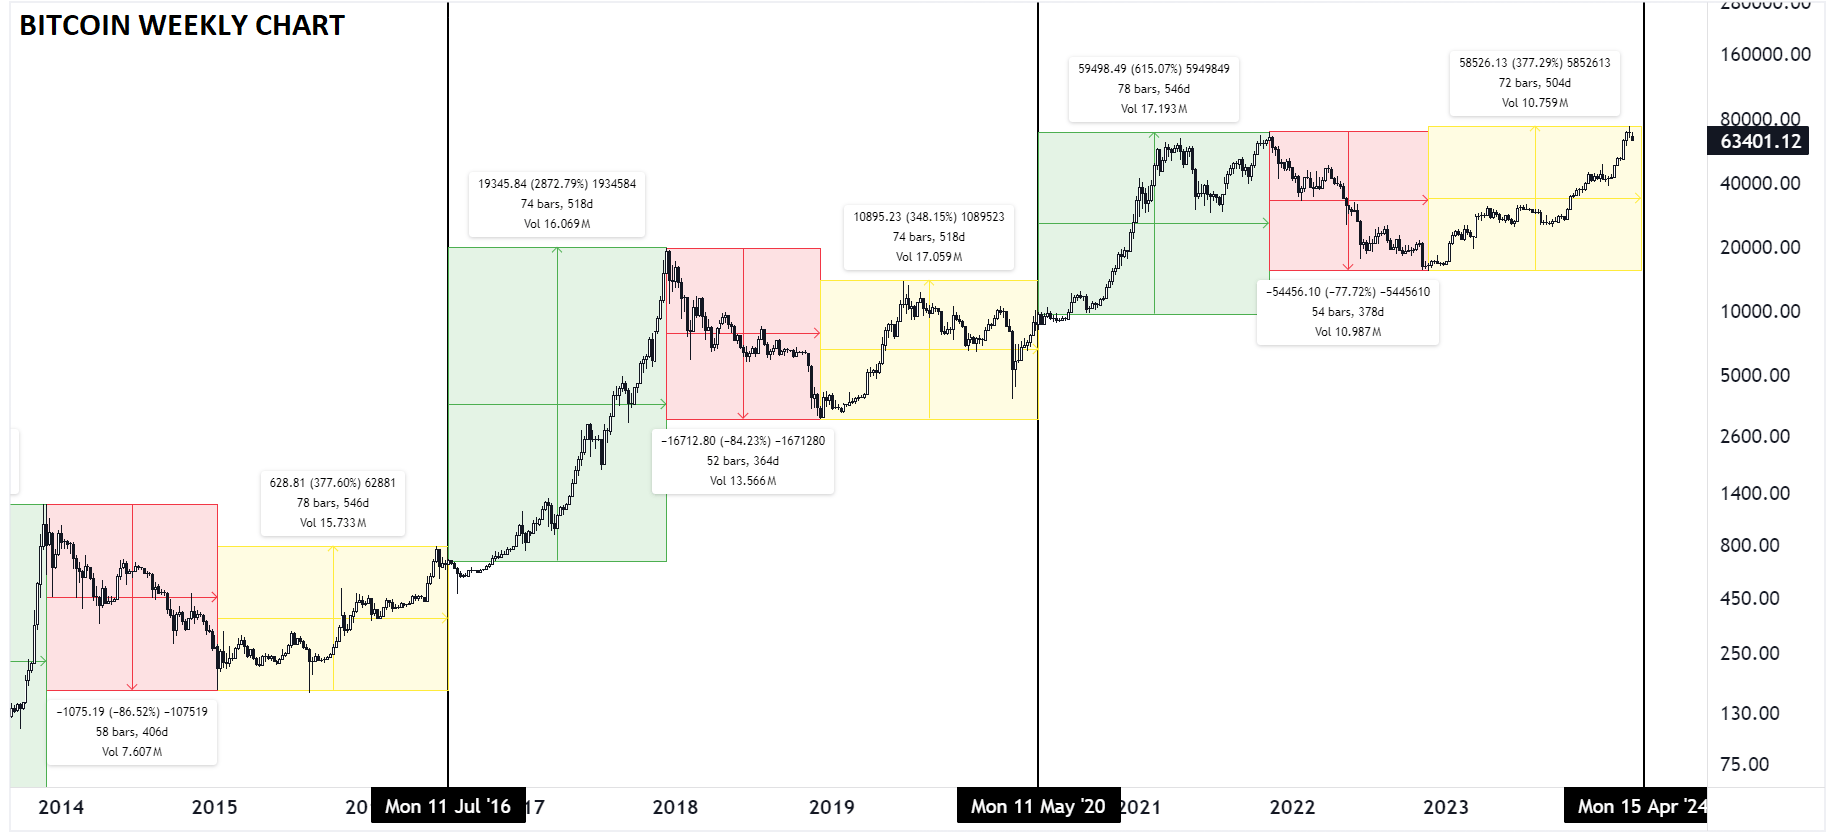
Source: TradingView, StoneX
Beyond pure cyclical analysis, there are several potential catalysts that could prompt a drawdown in the cryptoasset market. For one, the expected shift to easier monetary policy across the developed world has not developed as expected, with inflation running stubbornly above major central banks’ targets. If economic growth and price pressures remain elevated throughout the second quarter, the widely-anticipated “pivot” to interest rate cuts may be pushed back further, making the policy backdrop more of a headwind for Bitcoin and other cryptoassets than expected.
One other potential risk to Bitcoin and other cryptoassets is the upcoming May 23rd deadline for the SEC to decide whether to approve US ETFs for Ethereum, the second-largest cryptoasset. While an approval could certainly be a bullish development, the odds appear to be against it as of writing. Despite repeated losses on anti-crypto regulation in court cases over the last few quarters, the SEC is refusing to engage with issuers and appears to be relatively hostile toward Ethereum. While not a development that would necessarily effect Bitcoin directly, ongoing regulatory angst toward the broader cryptoasset space could still lead to a pullback in Satoshi’s creation.
Why Bitcoin Likely Has Not Reached a Cycle Top Yet
Over a longer-term horizon though, there are plenty of indicators that suggest we’re still a decent distance, in both time and price, from a cycle top in Bitcoin.
The historically-reliable MVRV (Market Value to Realized Value) Z-score, which compares the current price to the aggregate cost paid for all outstanding Bitcoin, has moved up from the < 1 level that typically marks bear market bottoms in early 2023 to the mid-2 range today. However, as the chart above shows, cycle tops don’t typically form until this indicator reaches levels above 7, suggesting that we may be far from a long-term top:
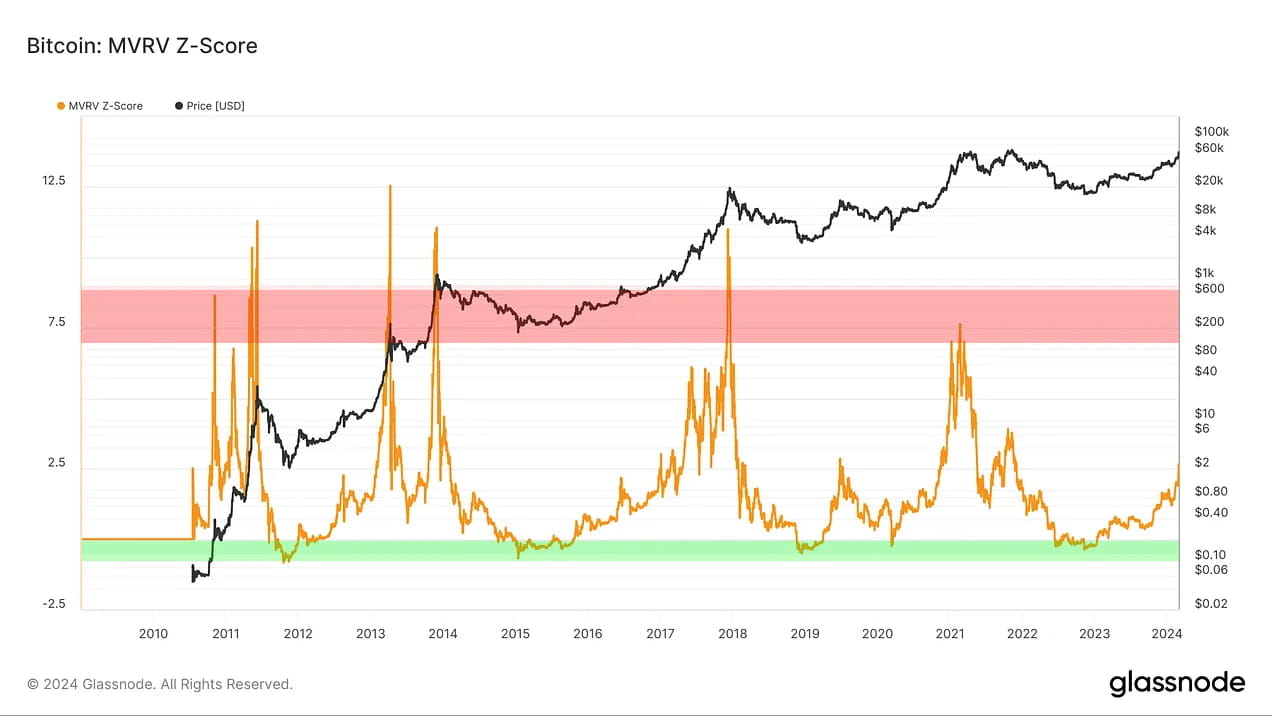
Source: Glassnode
A final consideration is the behavior of long-term holders. As we noted in our full-year outlook, those who have held their Bitcoin for more than a year, almost tautologically, are not trying to make a “quick buck” off the cryptocurrency; rather they are more likely to be “true believers” or “HODLers” who are unlikely to sell unless they’re sitting on a truly massive gain.
As the chart below shows, the proportion of Bitcoin that has been held for at least a year started 2024 at record highs above 70%, and despite the Q1 run-up, has only declined slightly to about 68% today. These experienced HODLers historically start to sell aggressively in the late stages of a bull market, and given that they continue to hold strong for now, the effective liquid supply of Bitcoin available in the market remains low, a development that should continue to support prices moving forward:
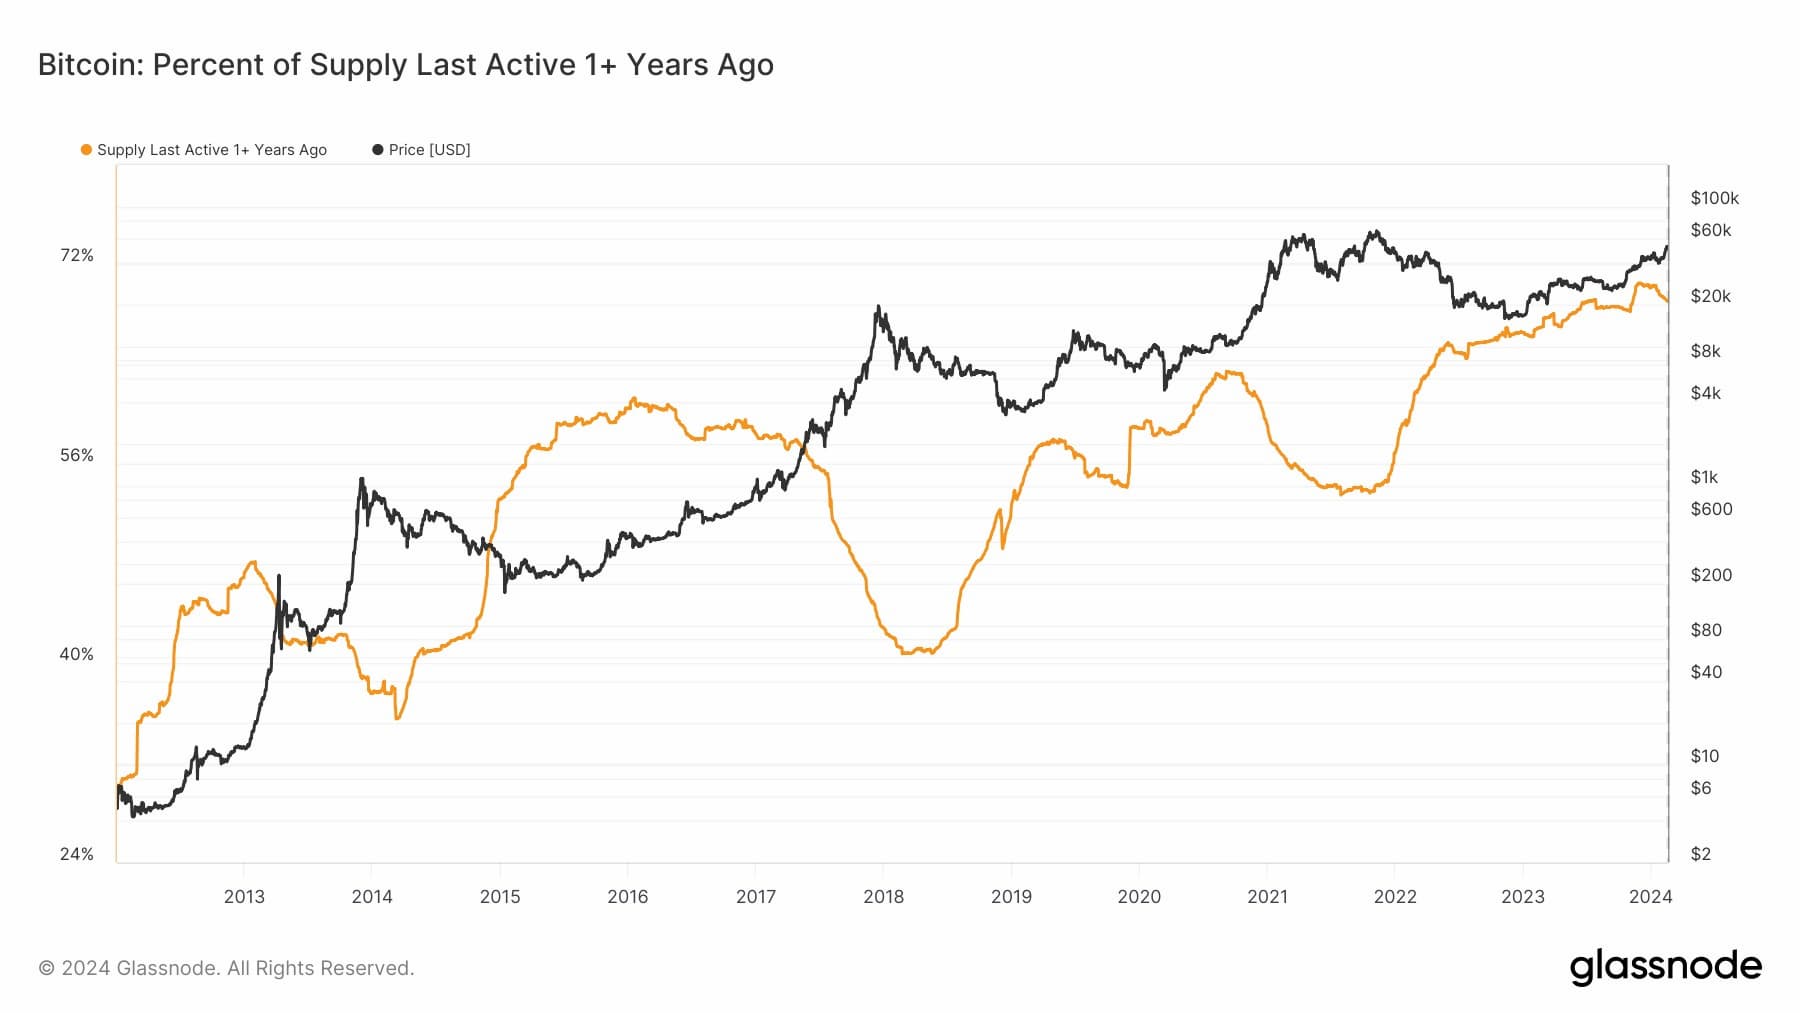
Source: Glassnode
As always, the catalysts we highlight in this report may not play out as expected – and to some extent, they may already be priced in so readers should always exercise caution when trading Bitcoin and other cryptoassets. As always, it will be critical to monitor a broad swath of macroeconomic and crypto-specific metrics as the year develops.
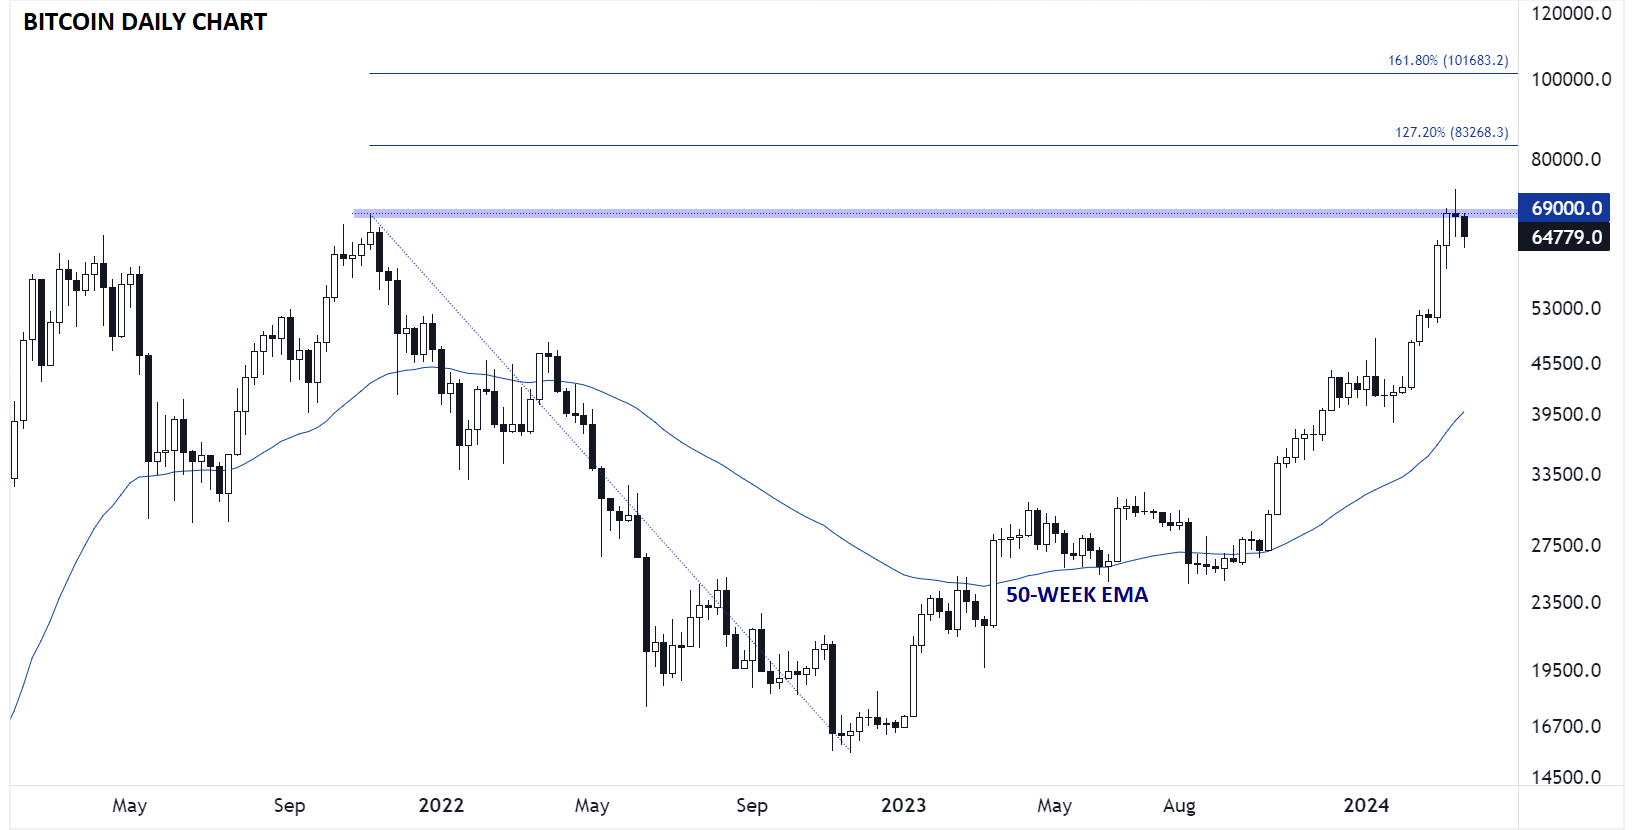
Bitcoin Technical Analysis – BTC/USD Weekly Chart
Source: TradingView, StoneX
Turning to more traditional technical analysis, we can see that the cryptocurrency set an incremental record high near $73K before pulling back into the end of March. For the early part of the quarter, a key question will be whether that move represents a “false break” of resistance that could lead to a deeper retracement or a mere pause at the previous high that could quickly give way to the next leg of the uptrend. After a stellar Q1, Bitcoin could well drop toward $50K or even $40K, where it traded when the ETFs were initially approved and keep its longer-term uptrend intact; only a move below its 50-week EMA would raise red flags for bulls. Meanwhile to the topside, there’s little in the way of meaningful resistance until the 127.2% and 161.8% Fibonacci extensions of the 2022 drop at $83K and $102K if resistance near $70K is cleared.
-- Written by Matt Weller, Global Head of Research
Follow Matt on Twitter: @MWellerFX