

- S&P 500 outlook: June rate cut uncertainty amid economic resilience
- Stocks wobble ahead of CPI
- S&P 500 technical analysis shows bullish trend is starting to weaken
US markets struggled to sustain an early advance, falling shortly after the open. Despite attempts to bounce back, major indices remained in the red. Investors are cautious ahead of the publication of the CPI report on Wednesday and bank earnings on Friday. Nvidia's decline after Intel's AI chip unveiling added to market uncertainty.
Video: S&P 500 outlook and technical insights on Gold, WTI and FX majors
Stocks wobble ahead of CPI
US markets struggled to sustain the early advance, falling shortly after the open. Though the major indices were attempting to bounce back at the time of writing, the markets remained in the red. Investors are not taking many chances ahead of the publication of CPI report on Wednesday and bank earnings on Friday. Nvidia, which was single-handedly responsible for much of last quarters gains, broke below $850 support after Intel unveiled a new version of its own AI chip.
Last week saw the markets drop sharply after hitting fresh record highs in the first trading day of the month and quarter. The losses were quite pronounced on Thursday of last week, before calm returned on Friday. However, it looks like investors are not done taking profit following the massive gains in the last two quarters.
CPI inflation is expected to tick higher to 3.4% YoY in March, up from 3.2% in February, highlighting the sticky nature of consumer prices at the start of this year.
S&P 500 outlook: June rate cut uncertainty amid economic resilience
Meanwhile, there are renewed concerns about inflation and the market’s pricing of the probability of a June cut have fallen to basically a coin flip. This is because US economic data has remained quite resilient despite the Fed’s sharp tightening of its belt, and FOMC officials have pushed back against the need for easing too soon or too aggressively.
This is actually why gold has been on the rise. Governments are encountering growing challenges in managing their debt as yields rise, posing a greater hurdle to borrowing without elevating debt-to-GDP ratios to concerning levels. Despite these concerns, stock market investors have also largely disregarded worries about overextended valuations throughout much of 2024 thus far. However, as we transition into the second quarter and delve further into the year, it remains to be seen whether this sentiment will shift.
That said, bearish speculators still need to see a confirmed reversal signal of the charts given the strength of the rally in the past 5 months or so.
S&P 500 analysis: technical factors and levels to watch
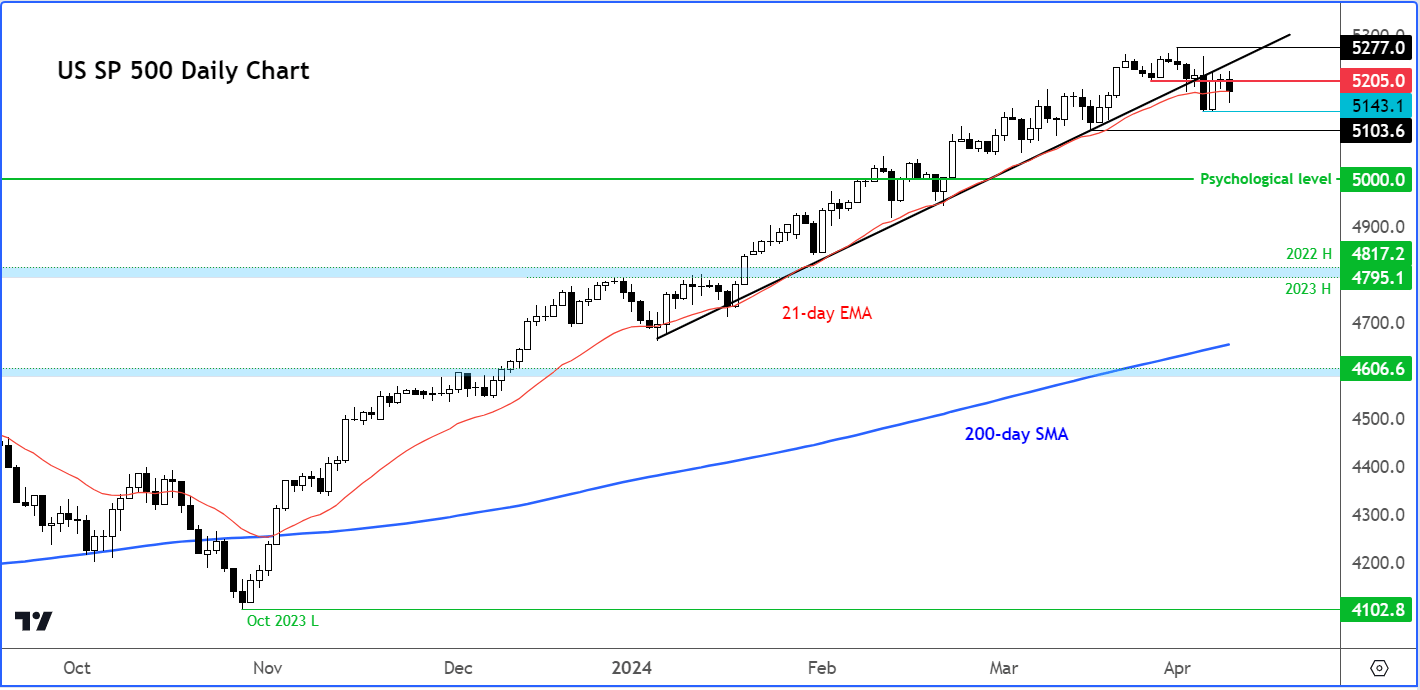
Source: TradingView.com
The breakdown of the bullish trend line on the S&P 500 chart is a sign that the rally is at least pausing for a breather. The bears will still need to see further evidence of a market top. In the last week and a half, though, price action has been more favourable to the bears with key short-term support at 5205 breaking down. This level has now turned into a bit of resistance, with the bulls so far unable to reclaim the broken trend line. A potential close below the 21-day exponential moving average, which has successfully defended all the bearish attempts this year, would make things a lot more interesting. Otherwise, it is likely to be more of the same: minor dips being bought.
-- Written by Fawad Razaqzada, Market Analyst
Follow Fawad on Twitter @Trader_F_R
How to trade with City Index
You can trade with City Index by following these four easy steps:
-
Open an account, or log in if you’re already a customer
• Open an account in the UK
• Open an account in Australia
• Open an account in Singapore
- Search for the company you want to trade in our award-winning platform
- Choose your position and size, and your stop and limit levels
- Place the trade
Latest market news
Yesterday 01:32 PM
Yesterday 09:35 AM
Yesterday 07:23 AM
Yesterday 04:48 AM
Yesterday 12:17 AM
July 25, 2024 10:39 PM
Latest SPX 500 articles

July 25, 2024 01:30 PM

July 23, 2024 11:45 AM

July 22, 2024 02:12 PM

July 18, 2024 11:35 AM