
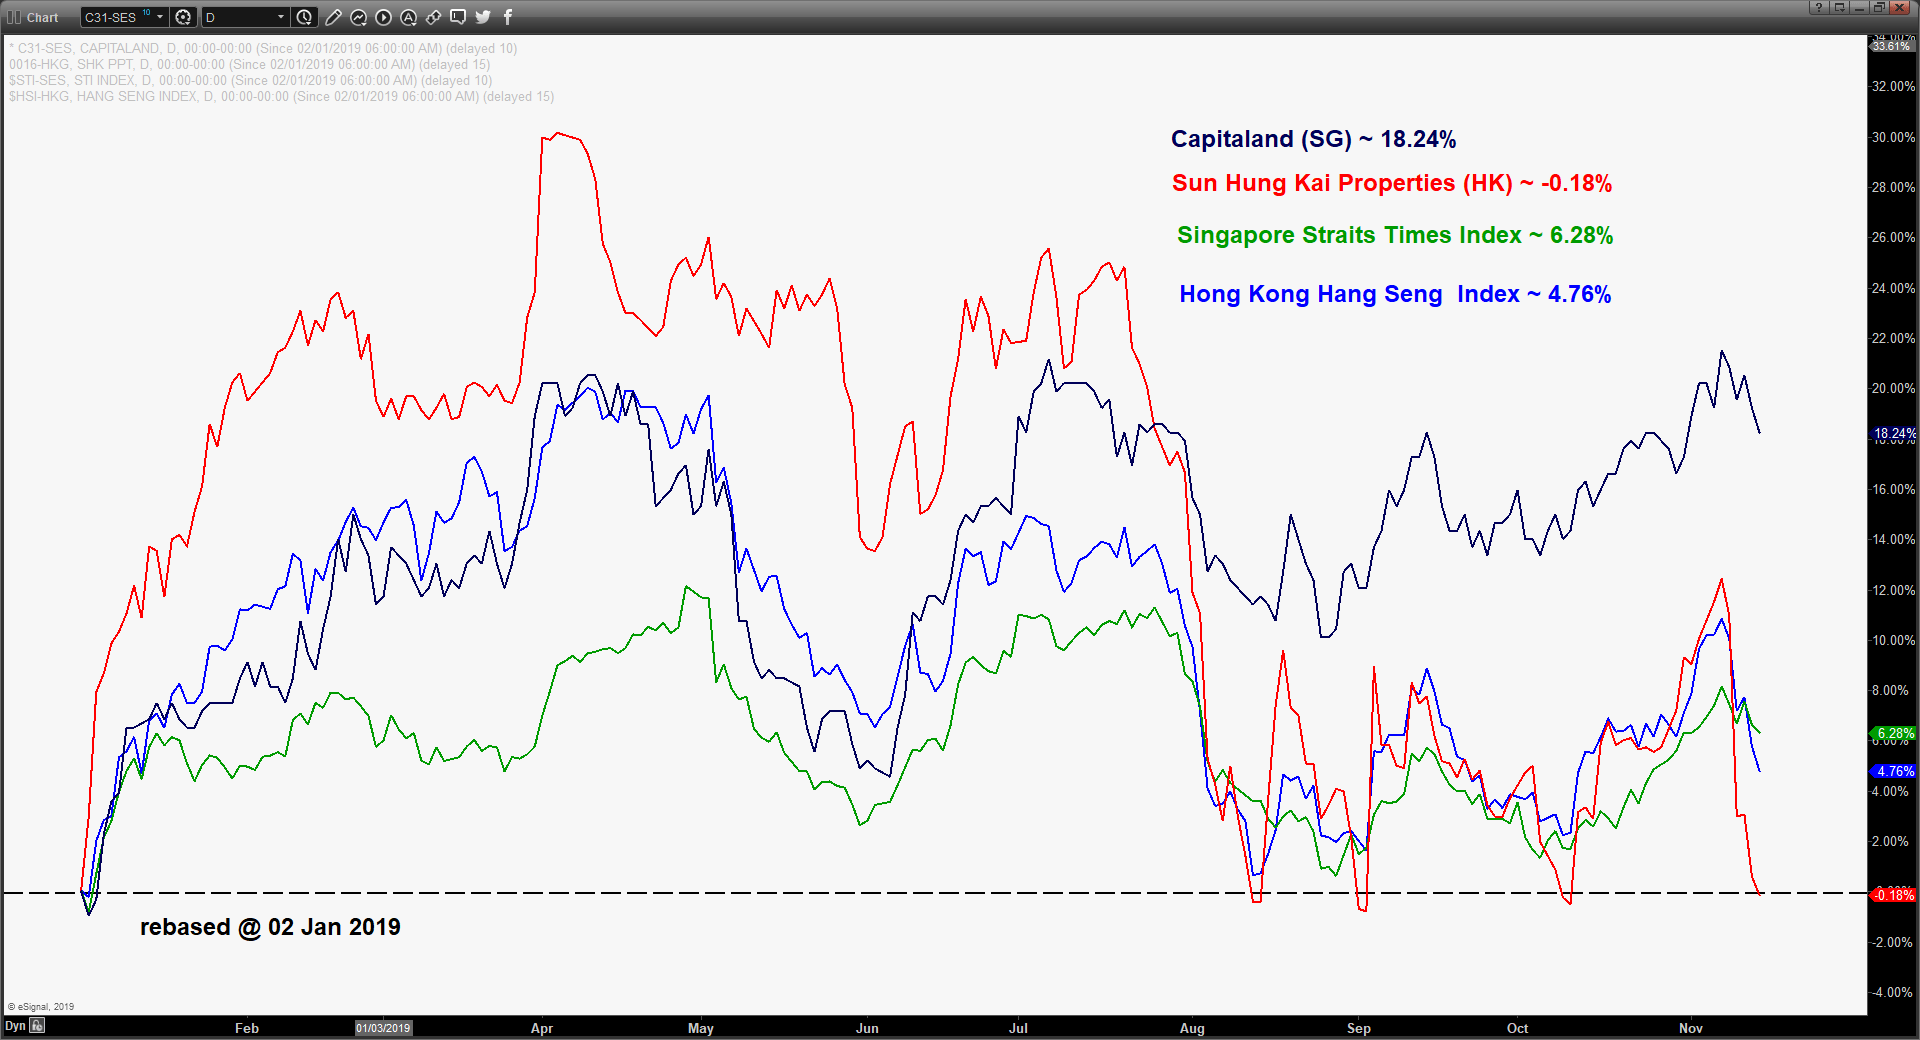
Both Hong Kong and Singapore are considered major financial centres in the Asia Pacific region coupled with significant investment inflows into their respective property markets as well.
The recent on-going domestic unrest in Hong Kong since Jun 2019 has crippled its economy and hampered Hong Kong’s ranking as a top preferred choice for property related investments. Thus, Singapore based property developers are likely benefit from this outcome as flows are being diverted to Singapore from Hong Kong.
We will be focusing on two major property developers from each region (Capitaland – Singapore & Sun Hung Kai – Hong Kong) that have similar business models with interest in residential and commercial projects from a technical analysis perspective.
2019 year to date performance of Sun Hung Kai Properties & Capitaland till 13 Nov 2019
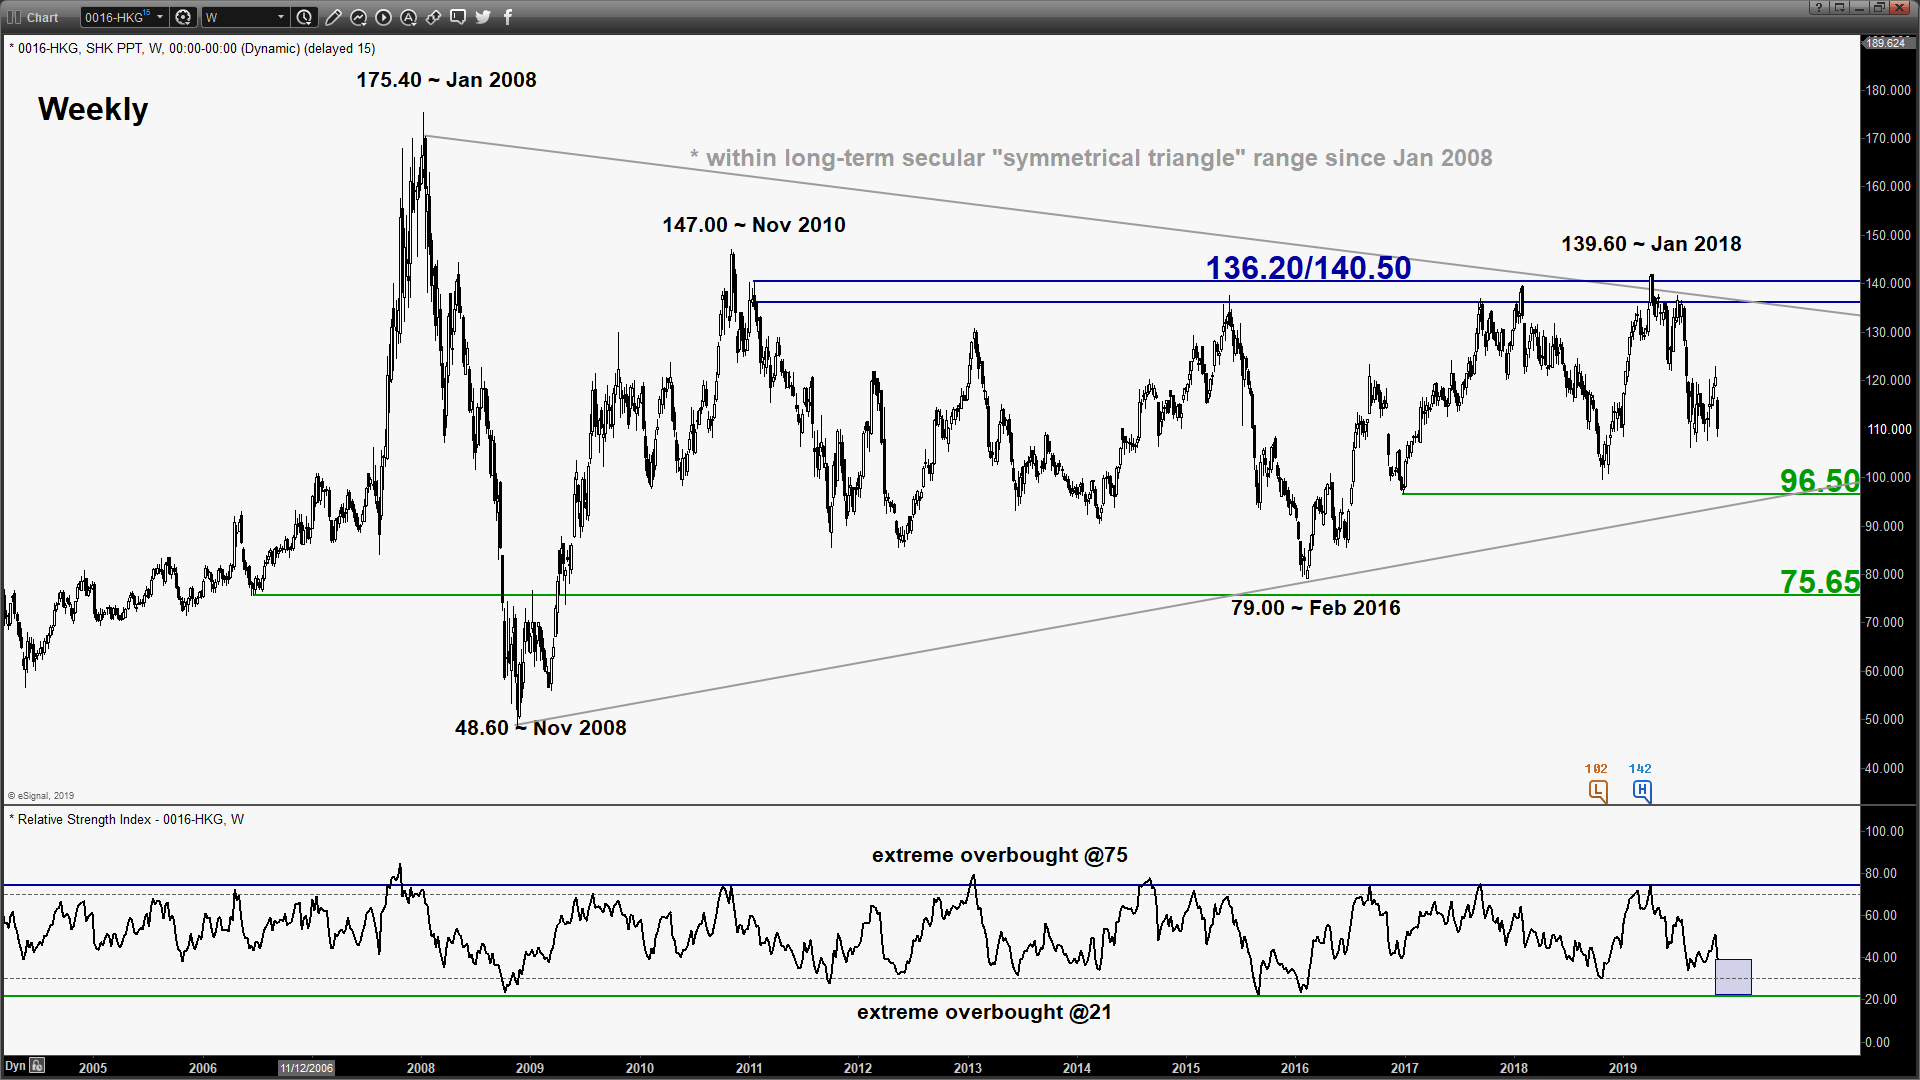
Sun Hung Kai Properties (HK property stock/0016 HKG) – Further potential drop
click to enlarge chart
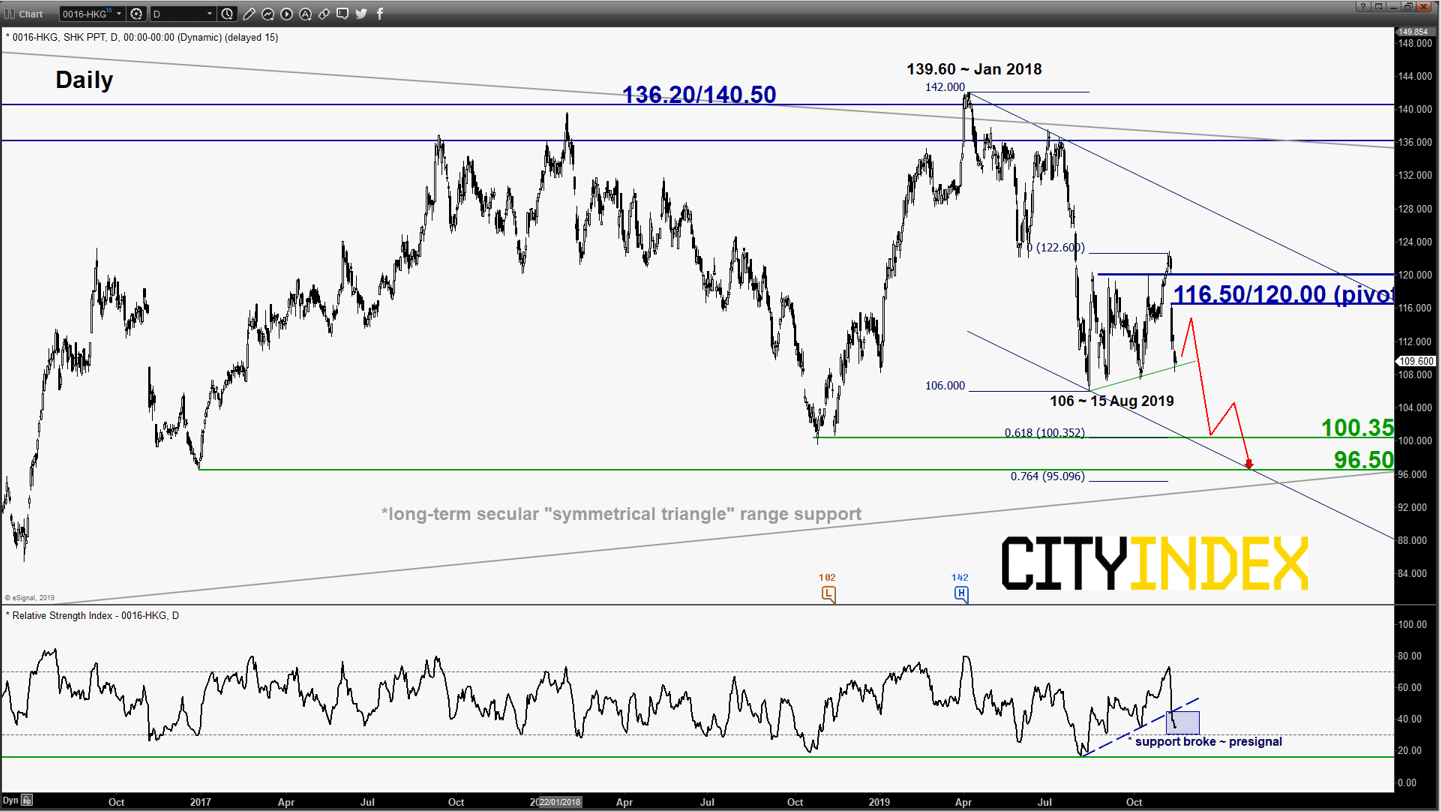
Key Levels (1 to 3 weeks)
Pivot (key resistance): 116.50/120.00
Supports: 100.35 & 96.50
Next resistance: 136.20/140.50
Directional Bias (1 to 3 weeks)
Bearish bias in any bounces below 116.50/120.00 key pivotal resistance for a further potential decline to target the next supports at 100.35 and 96.50 within a long-term secular “Symmetrical Triangle” range configuration.
However, a clearance with a daily close above 120.00 invalidates the bearish scenario for another round of corrective rebound to retest 136.20/140.50 (secular “Symmetrical Triangle” range resistance & Jan 2018 swing high area).
Key elements
- The share price of Sun Hung Kai Properties has been evolving within a long-term secular “Symmetrical Triangle” range configuration since its Jan 20008 all-time high of 175.40 with upper limit/resistance at 136.20/140.50 and lower limit/support at 96.50.
- In the medium-term, it has been trading within a descending channel in place since 08 Apr 2019 high of 142.00 with downside momentum remains intact. The daily RSI oscillator has staged a bearish breakdown below its corresponding ascending support from its oversold level in parallel with the price action support from 15 Aug 2019 low of 106.00. This observation indicates a presignal of a potential breakdown on the price action support.
- The key medium-term pivotal resistance of 116.50/120.00 is defined by the gapped down on 11 Nov 2019 and the 61.8% Fibonacci retracement of the on-going drop from 07 Nov high to 13 Nov 2019 low.
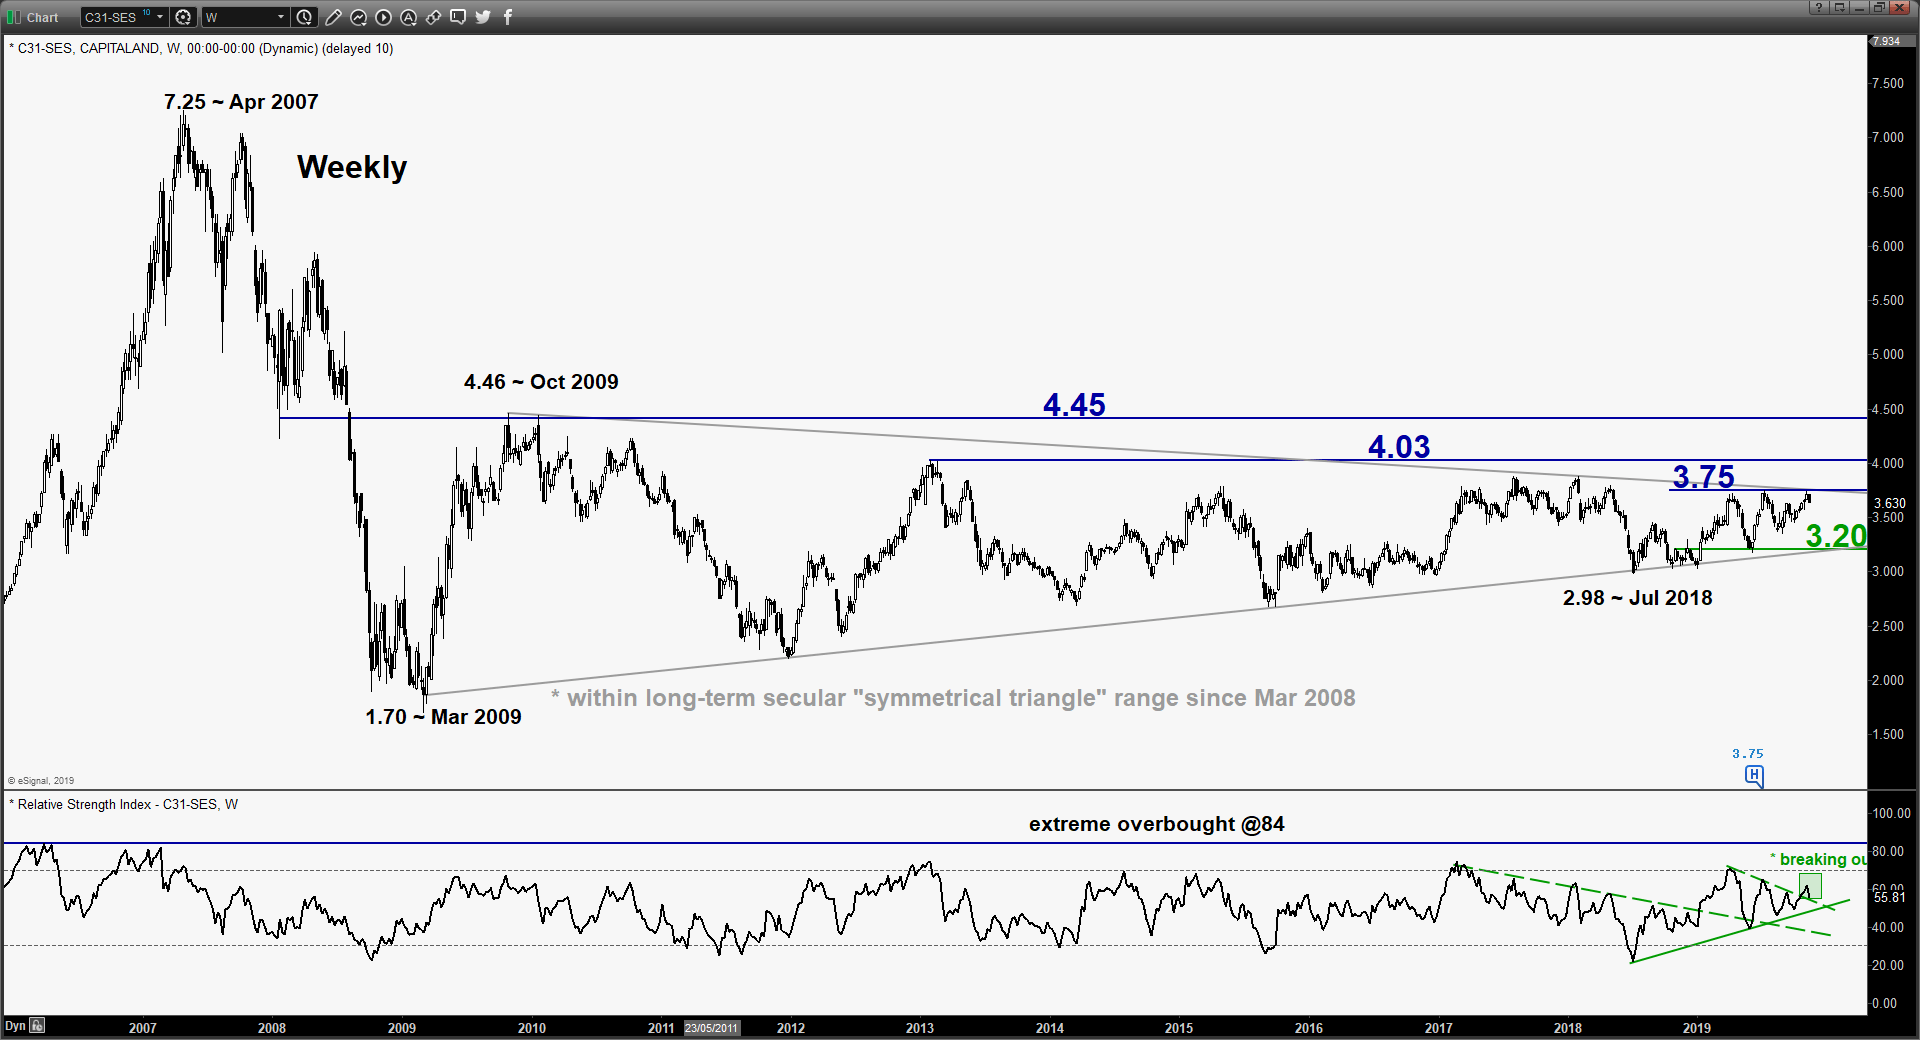
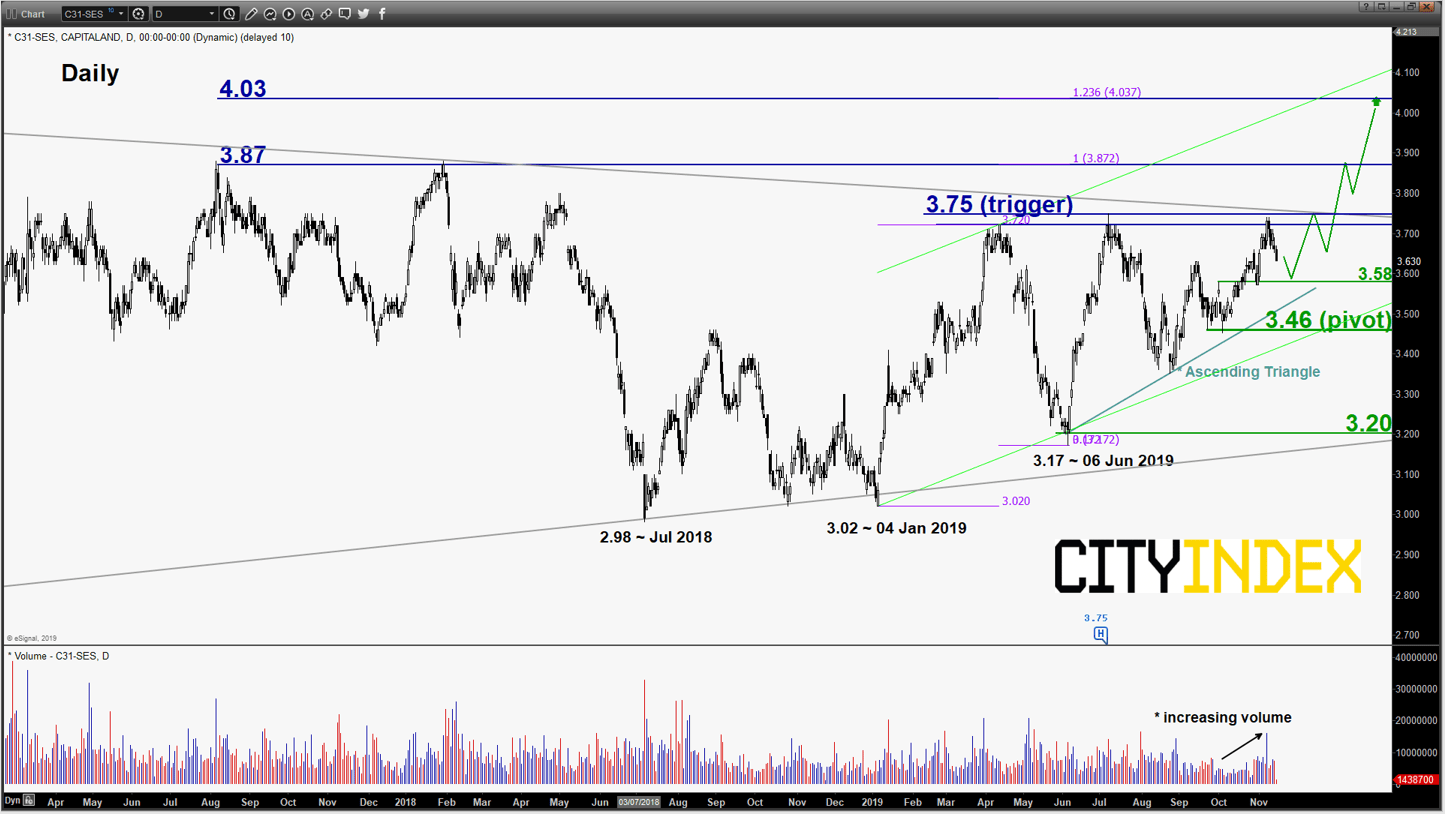
Capitaland (SG property stock/C31 SGX) – Potential bullish breakout from 10-year range
click to enlarge charts
Key Levels (1 to 3 weeks)
Intermediate support: 3.58
Pivot (key support): 3.46
Resistances: 3.75 (trigger), 3.87 & 4.03
Next support: 3.20
Directional Bias (1 to 3 weeks)
Bullish bias in any dips above 3.46 key pivotal support and a break with a daily close above 3.75 is likely to trigger a potential bullish breakout from its 7-month “Ascending Triangle” range configuration in place since 10 Apr 2019 high to target the next resistances at 3.87 and 4.03
On the other hand, failure to hold at 3.46 negates the bullish tone a slide back to retest the long-term secular “Symmetrical Triangle” range support at 3.20.
Key elements
- The share price of Capitaland has been evolving within a long-term secular “Symmetrical Triangle” range configuration since Mar 2009 low of 1.70 with upper limit/resistance at 3.75 and lower limit/support at 3.20
- The weekly RSI oscillator has staged a bullish breakout from a recent corresponding descending resistance in parallel with the price action swing high area of Apr 2019. In conjunction, the recent up move in price action from 26 Aug low to 07 Nov 2019 high has been accompanied by an increasing volume. These observations suggest that medium-term upside momentum has resurfaced that increases the odds of a bullish breakout from the “Ascending Triangle” range configuration in place since 06 Jun 2019 low.
- The key medium-term pivotal support is defined by “Ascending Triangle” range support and a Fibonacci retracement cluster.
Charts are from eSignal
Latest market news
Yesterday 10:44 PM
Yesterday 05:00 PM
Yesterday 03:13 PM
Yesterday 01:39 PM
Yesterday 11:05 AM
Latest Shares market articles

November 2, 2023 01:41 PM

November 1, 2023 01:33 PM

October 31, 2023 01:15 PM

October 31, 2023 10:24 AM