August 26, 2022 10:05 AM

The a2 Milk company was founded in New Zealand in 2000 and is dual listed on the ASX and the NZSX. a2m’s branded milk is different from conventional cows’ milk because it comes from cows selected to naturally produce only the A2 protein type and no A1, alleged to be harmful.
a2m’s products are sold primarily in Australia, New Zealand, Greater China, and North America. It reports its Full Year numbers on Monday, August 29th.
By its own admission, a2M has had an extraordinary journey, disrupted in FY 2021 by the arrival of COVID-19, which saw sales surge on a wave of panic buying, only to suffer a dramatic reversal in fortunes.
The closure of international borders brought the daigou/reseller channel to a halt, accounting for 60-70% of a2M’s revenue from Great China. And lower birth rates in China negatively impacted the size and growth of the China infant nutrition market.
As a result, a2M reported NPAT for the 1H 2022 of NZ $56.1mio. Below the $60million that analysts were expecting and 50% below the NZ$120mio reported in 1HY21.
In response, management announced it would act to stabilise the business, writing down excessive stock and bolstering its leadership team. It also noted the key to a2M's turnaround is building on its relatively small market share in China.
“The Company’s outlook for 2H22 revenue has improved. It is still expected to be significantly higher than 2H21 and with growth now expected on 1H22 and for FY22 ahead of initial expectations due mainly to growth in China label and English label IMF."
The market is looking for Full Year NPAT of NZ$112mio, up from $80.7m for FY2021. The company is not expected to report a dividend.
a2M Share Price Chart
After reaching a high of $20.05 in June 2020, the a2M share price fell over 80% to a low of $3.90 in May 2022. Since then, the share price has traded sideways between support on the downside at $3.90 and resistance at $5.20ish.
There are preliminary signs of basing and providing support at $3.90 holds, a break above range highs at $5.20/40 could open up a move towards resistance $7.40/50 area.
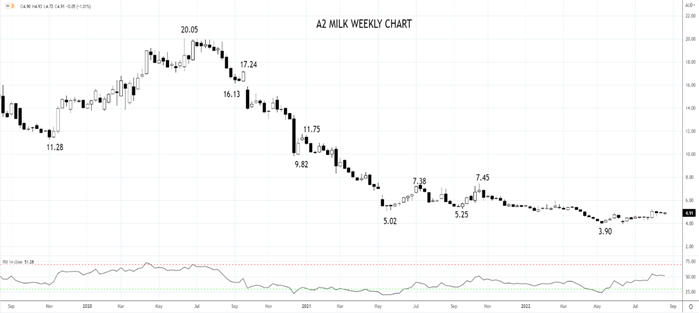
Source Tradingview. The figures stated are as of August 26th, 2022. Past performance is not a reliable indicator of future performance. This report does not contain and is not to be taken as containing any financial product advice or financial product recommendation
How to trade with City Index
You can trade with City Index by following these four easy steps:
-
Open an account, or log in if you’re already a customer
• Open an account in the UK
• Open an account in Australia
• Open an account in Singapore
- Search for the company you want to trade in our award-winning platform
- Choose your position and size, and your stop and limit levels
- Place the trade
Latest market news
Yesterday 01:32 PM
Yesterday 09:35 AM
Yesterday 07:23 AM
Yesterday 04:48 AM
Yesterday 12:17 AM
July 25, 2024 10:39 PM
Latest Australia 200 articles

May 6, 2024 11:43 PM

December 14, 2023 02:31 AM

November 1, 2022 05:18 AM
November 1, 2022 05:18 AM