
S&P500 Forecast: SPX rebounds as big tech recovers & inflation is in focus
Article
Today 2:32 PM


Certain chart patterns can also form the basis of advanced strategies – not necessarily because they’re difficult to understand, but because they’re prone to false signals which means more experience is useful. In this lesson, we’ll take a look at four advanced chart patterns:
The ABCD pattern is comprised of three consecutive price swings, resembling a lightning bolt on your price chart. It’s called ABCD due to the four points you’ll identify.
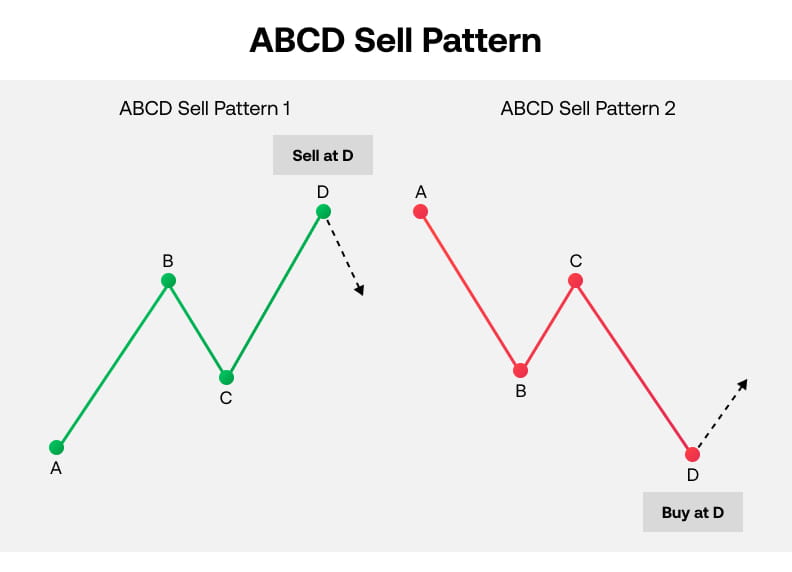
The shape can be a bullish or bearish sign depending on the direction of the swings. For example, if points B and D are higher than A and C it is a bearish signal and if B and D are lower than A and C, then it’s a bullish signal.
The pattern shows the perfect balance between price and time – also known as measured moves. There are three general guidelines for an ABCD pattern:
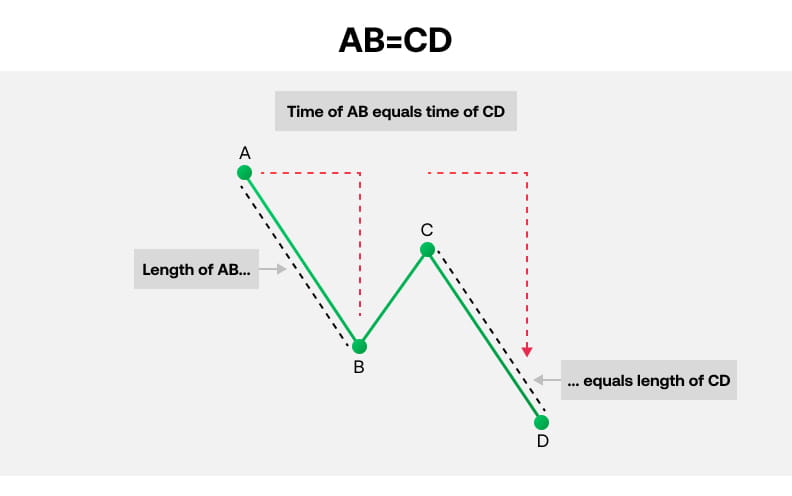
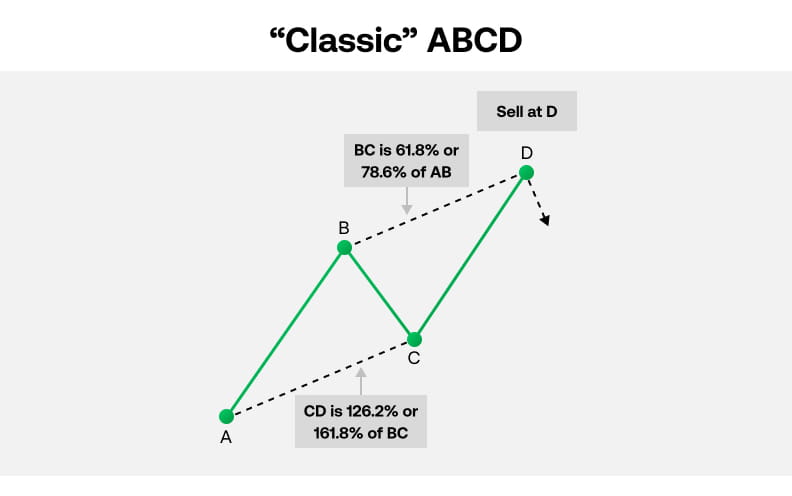
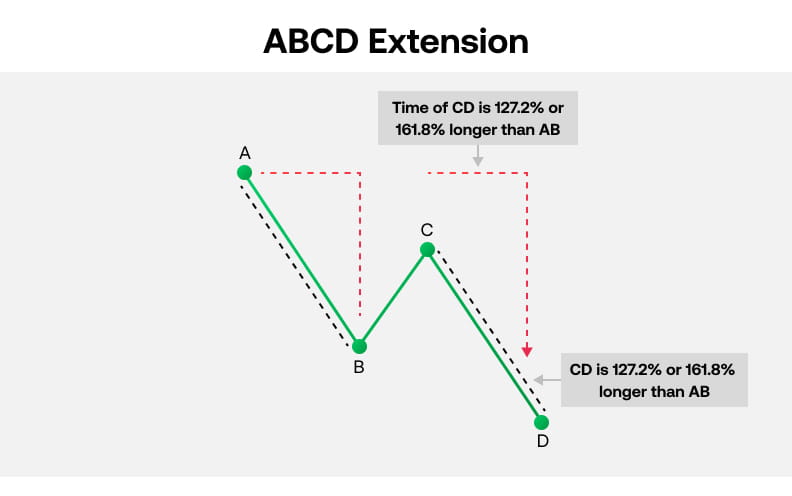
You might recognise those figures from our previous lesson. They’re Fibonacci ratios, which is why retracements are commonly used to confirm the approximate range of the ABCD pattern.
Each leg is typically within a range of 3-13 periods on any given timeframe, although they can be longer. Traders may interpret longer patterns as a sign to move to a larger timeframe to check for trend/Fibonacci convergence.
The ABCD pattern is a leading indicator, which means it can help to predict movements, but it’s not an exact science and can be prone to false signals.
The Gartley pattern was identified by H.M. Gartley. It’s also known as the ‘222’ pattern because that’s the page of his book it’s found on.
The pattern is essentially the ABCD pattern that we’ve just covered but preceded by a high or a low. A Gartley is an indication that a correction is taking place and the overall trend will continue.
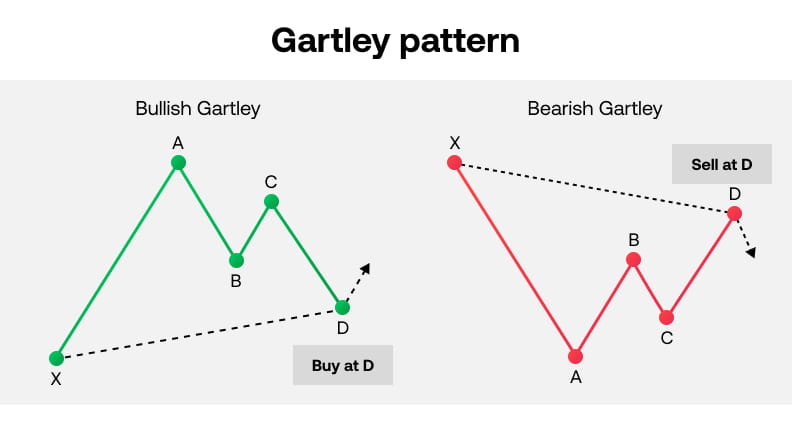
A bearish Gartley pattern would be a high (X) followed by a sell ABCD pattern where the D is a sell signal. It indicates the overall bearish trend is going to continue.
The bullish Gartley is the opposite. It’s a low point (X) followed by a buy ABCD pattern, where D is the signal to buy. It indicates the overall bullish trend is continuing.
Like the ABCD pattern, the Gartley is formed at Fibonacci retracement levels, specifically 61.8% and 38.2%.
The Gartley pattern has the following characteristics:
Point D is the buy or sell signal. It is the sign that the original downtrend is resuming.
The Gartley pattern has been used as the base for a lot of other advanced charting patterns. We’re going to look at two now: the crab and the butterfly.
The crab pattern was identified by Scott Carney in 2000. He believed it was the most accurate of all the so-called harmonic patterns – patterns that are the basis for strategies.
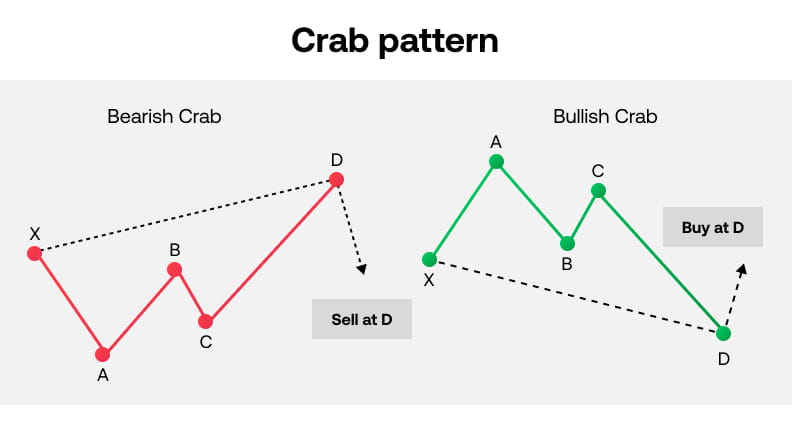
The crab pattern has the following characteristics:
Point D is the buy or sell signal, showing us that the trend is resuming its original direction.
The Butterfly pattern is pretty well known in its own right, but it is technically a Gartley pattern. It occurs when AB is a 78.6% retracement of XA. Here’s the exact set-up:
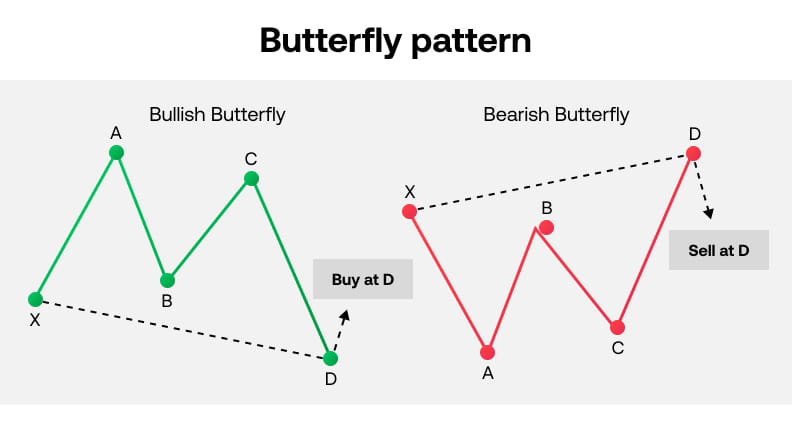
Point D is the buy or sell signal, showing us that the trend is resuming its original direction.