


- Crude oil analysis: What does OPEC’s decision mean for oil prices?
- WTI technical analysis point higher

Crude oil prices were lower for most of Monday’s session, despite strong indications last week that more gains could be on the way. Friday’s breakout took place even before the OPEC+ decided to extend its supply cuts at the weekend. It is likely that investors were expecting to see an extension anyway, while signs of stronger-than-expected demand out of Asia also helped to lift crude prices on Friday. This week, we will have plenty of top-tier data and a couple of central bank decisions to influence financial markets, including the monthly US non-farm payrolls report on Friday. Barring surprising weakness in global data to point to subdued demand for oil, crude prices are likely to extend their gains in light of last week’s bullish breakout and an overall supportive macro backdrop – mainly, thanks to the ongoing intervention by the OPEC+ group.
Before looking at the chart of oil, which strongly indicates towards further gains, despite a weaker start to the new trading week, let’s discuss what the OPEC’s latest decision means for oil prices…
Crude oil analysis: What does OPEC’s decision mean for oil prices?
At the weekend, the OPEC+ prolonged oil supply reductions until the middle of the year to prevent a global surplus and, naturally, help support prices. Leading this initiative once more were Saudi Arabia and Russia. The decision to extend the supply cuts was made to counterbalance a seasonal decline in fuel consumption and the heightened production from competitors such as US shale producers.
Traders are now faced with the dilemma of whether to dive into oil following OPEC's decision or adopt a wait-and-see approach to gauge whether the bulls will maintain control at the outset of this week. After all, OPEC's decision was widely anticipated, while economic uncertainties in China also add to the sense of caution.
It is evidently in the best interest of OPEC+ nations to witness higher oil prices. Nevertheless, despite Middle Eastern conflicts disrupting regional shipping, ample supplies have kept oil prices hovering around $80 per barrel. However, this level may not suffice for many OPEC+ members like Saudi Arabia and Russia, which necessitate higher prices for economic and strategic motives.
For Saudi Arabia, oil prices above $90 per barrel are imperative to support the nation's economic diversification efforts, while Russia aims to sustain revenue for its various activities, including the conflict in Ukraine. Russia, which had been granted a special exemption allowing for a division between production and exports, will now prioritise reducing crude production in the upcoming quarter. This commitment might appease Saudi Arabia, which had previously expressed disappointment in Moscow's reluctance to directly curtail production. Moreover, it is likely to be more effective in supporting prices.
The primary risk lies in the potential increase in US supplies offsetting the efforts of the OPEC+ group to underpin prices. Hence, investors have not rushed to purchase oil each time the OPEC has extended its supply cuts. The International Energy Agency proposes that ongoing reductions will be necessary beyond June due to the deceleration in global oil demand growth and the escalation in supply from the Americas.
WTI technical analysis point higher
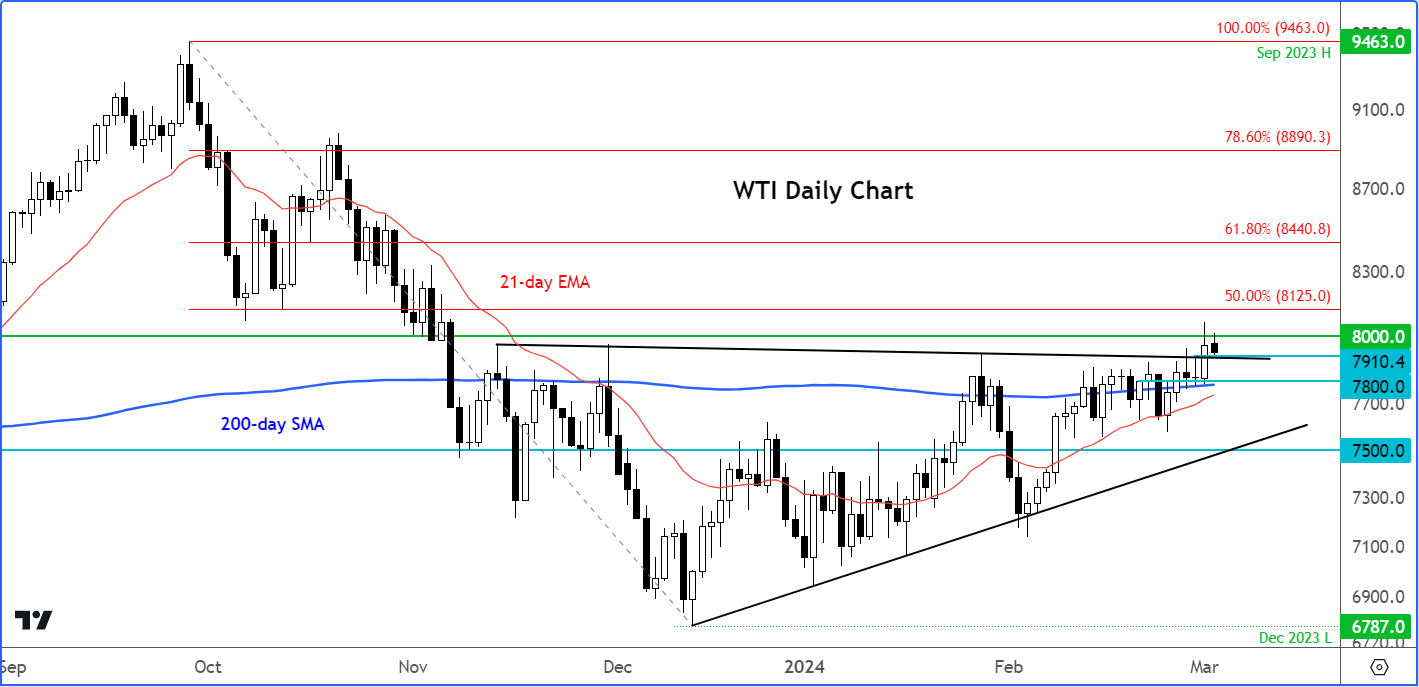
Source: TradingView.com
Friday’s rally saw crude oil break a major resistance zone between $78.00 to $79.10. This is where oil prices had repeatedly sold off from on multiple occasions since November. Now that we have a clean break above it, the technical path of least resistance has been confirmed to the upside.
The bulls need to hold their ground here to maintain the bullish momentum. If so, WTI could be heading towards the next potential resistance area around $82.00 next. An additional bullish target to keep an eye on is at $84.40, which corresponds with the 61.8% Fibonacci retracement level of the downswing from September.
The line in the sand for me is at around $78.00 now, where the rally in the latter half of last week occurred. Should oil prices break that level, then last week’s breakout signal will be invalidated. In this potential scenario, we could see a sharp withdrawal of bids, leading to a sharp correction. However, this is not my base case scenario.
-- Written by Fawad Razaqzada, Market Analyst
Follow Fawad on Twitter @Trader_F_R
How to trade with City Index
You can trade with City Index by following these four easy steps:
-
Open an account, or log in if you’re already a customer
• Open an account in the UK
• Open an account in Australia
• Open an account in Singapore
- Search for the company you want to trade in our award-winning platform
- Choose your position and size, and your stop and limit levels
- Place the trade
Latest market news
Yesterday 01:32 PM
Yesterday 09:35 AM
Yesterday 07:23 AM
Yesterday 04:48 AM
Yesterday 12:17 AM
July 25, 2024 10:39 PM
Latest Crude Oil articles

July 25, 2024 05:30 PM
July 18, 2024 10:00 AM

July 16, 2024 12:09 PM
July 15, 2024 07:18 AM