

When will Alibaba release Q2 earnings?
Alibaba will release second quarter results covering the three months to the end of September before US markets open on Thursday November 18.
Alibaba Q2 earnings preview: what to expect from the results
Annual active consumers are expected to grow by 14.35 million in the second quarter to end September at 842.35 million, while mobile monthly average users are forecast to rise by 22.17 million to 961.17 million.
Some analysts believe it could beat expectations by acquiring more users than forecast as Alibaba is regarded as one of the biggest beneficiaries of the hard stance taken by China against Covid-19. China continues to impose some of the strictest restrictions on mobility as part of the country’s zero-tolerance policy when it comes to the virus, which should have encouraged more people to shop online.
Analysts forecast Alibaba will report revenue of RMB204,933 million in the second quarter compared to RMB155,059 million the year before.
However, the firm is expected to continue to prioritise growing user and revenue numbers over profits as it looks to capitalise on the situation and attract as many people and businesses to its platform as possible by ramping-up spending on marketing, new tools and on offering more rebates to attract more merchants. Alibaba is anticipated to have spent more money to help it achieve its ambitions to have 1 billion active users by the end of its financial year to the end of March 2022.
Operating income was down 11% in the first quarter to RMB30,847 million and this is expected to plunge further to RMB20,098 million in the second – although that would be up from RMB13,634 million a year earlier.
Wall Street expects net income attributable to shareholders to drop to RMB23,879 million from RMB28,769 million last year. Diluted earnings per American Depositary Share (ADS) is forecast to drop to RMB8.34 from RMB10.48.
Below is an outline of what is expected for each of Alibaba’s divisions in terms of revenue, Ebita and operating income and how they compare on a quarter-by-quarter and year-on-year basis:
|
(RMB, millions) |
Q2 2022E |
Q1 2022 |
Q2 2021 |
|
Commerce Revenue |
178,835 |
180,241 |
130,922 |
|
EBITA |
39,506 |
45,591 |
45,958 |
|
Operating Income |
32,486 |
39,022 |
30,894 |
|
Cloud Computing Revenue |
19,523 |
16,051 |
14,899 |
|
EBITA |
419 |
340 |
-156 |
|
Operating Income |
-1,217 |
-1,643 |
-3,796 |
|
Digital Media Revenue |
8,855 |
8,073 |
8,066 |
|
EBITA |
-1,130 |
-419 |
-710 |
|
Operating Income |
-1,727 |
-1,010 |
-2,351 |
|
Innovation Revenue |
1,473 |
1,375 |
1,172 |
|
EBITA |
-2,463 |
-2,148 |
-2,381 |
|
Operating Income |
-3,371 |
-2,939 |
-4,282 |
It is also worth noting the strong demand seen during Alibaba’s annual 11.11 sales event that ran for 11 days to November 12. The company said the event generated RMB540 billion ($84.5 billion) in gross merchandise volume this year, which soared from RMB498 billion ($74.1 billion) in 2020 and from RMB268.4 billion ($38.4 billion) in 2019 – demonstrating the huge growth the event has seen in recent years. Although this occurred after the end of the second quarter, it does set a buoyant tone heading into the third.
Alibaba shares have plunged over 46% since hitting all-time highs in November 2020 and has lost over 26% in value since the start of 2021 after being caught-up in souring sentiment for Chinese stocks amid the regulatory crackdown happening in the country. But brokers remain bullish on the stock and its prospects with an average Buy rating and a target price of $243.13 implying there is over 43% potential upside from the current share price.
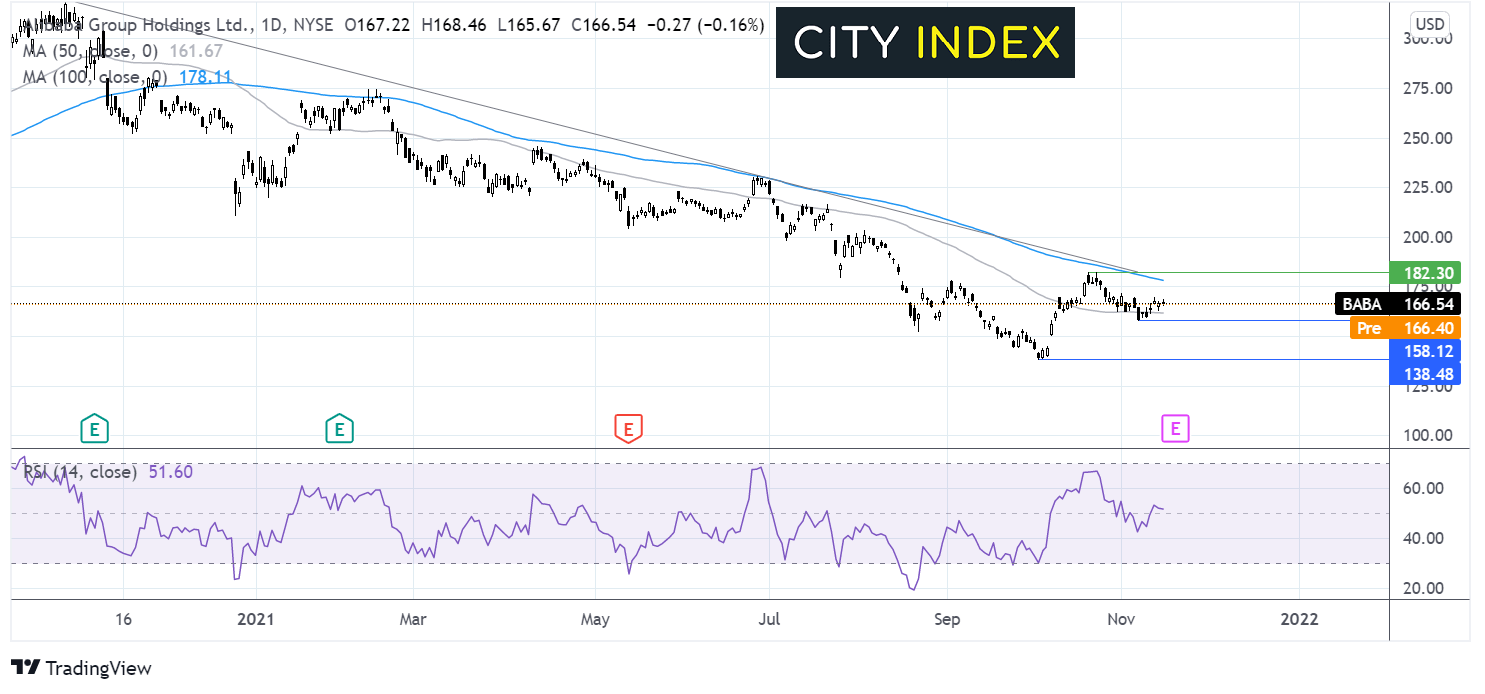
Where next for the Alibaba share price?
After reaching an all-time high of $319 in November 2020, the Alibaba share price has been trending lower, forming a series of lower lows and lower highs.
The price found a floor at $138, however the bounce higher off this level ran into resistance at $180. The price trades above its 50 sma but below its 100 sma and the RSI is neutral suggesting the price is waiting for its next catalyst.
Buyers might look for a move above 177 the 100 sma and the falling trend line to test $182, beyond here buyers could gain traction.
Meanwhile, sellers could look for a move below the 50 sma at $161 and last week’s low of $158 to target $138, the yearly low.
How to trade Alibaba shares
You can trade Alibaba shares with City Index in just four easy steps:
- Open a City Index account, or log-in if you’re already a customer.
- Search for ‘Alibaba’ in our award-winning platform
- Choose your position and size, and your stop and limit levels
- Place the trade
Latest market news
Yesterday 01:32 PM
Yesterday 09:35 AM
Yesterday 07:23 AM
Yesterday 04:48 AM
Yesterday 12:17 AM
July 25, 2024 10:39 PM
Latest Shares market articles

November 2, 2023 01:41 PM

November 1, 2023 01:33 PM

October 31, 2023 01:15 PM

October 31, 2023 10:24 AM