
Micron Technology (MU)
click to enlarge chart
Key technical elements
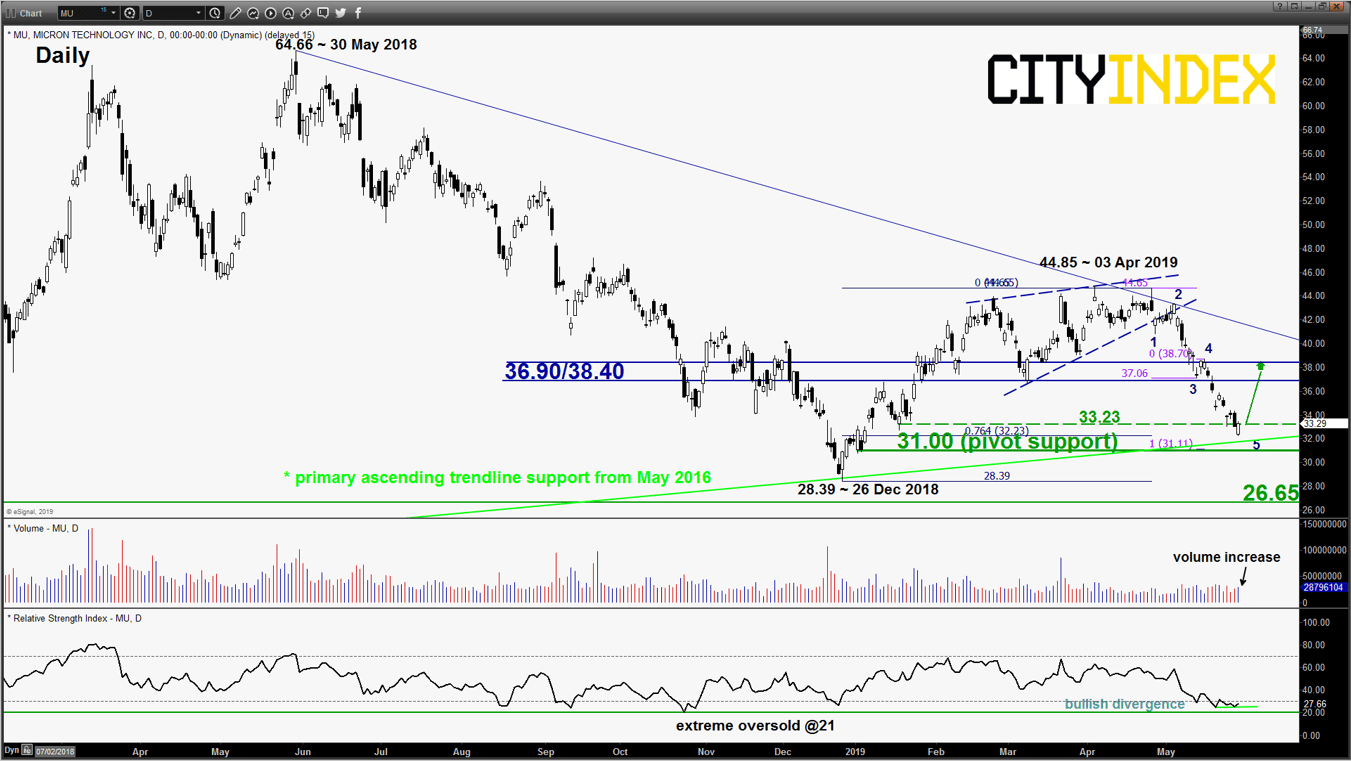
- In our previous “Stock Selection” report dated on 08 May 2019; we had highlighted a bearish setup in Micron Technology (MU). Its share price had declined as expected and hit the support/target of 32.75. Yesterday, 29 May, it printed a low of 32.17 (click here for a recap on our previous report).
- Right now, MU has managed to close higher from yesterday’s open of 32.32 right above a primary ascending trendline support from May 2016.
- Several elements have been sighted to indicate a potential short to medium-term corrective rebound to retrace the on-going impulsive down move from 03 Apr 2019 high to yesterday, 29 May low of 32.17.
- Yesterday’s rebound has been accompanied by an increase in volume above its prior average 3-day volume coupled with the daily RSI oscillator that has traced out a bullish divergence signal at its oversold region.
- Elliot Wave/fractal analysis has indicated that a completed 5-wave impulsive down move sequence of an intermediate degree from 25 Apr 2019 high which suggests the risk of an imminent corrective rebound.
- The next significant medium-term resistance zone stands at 36.90/38.40 which is also the 50% Fibonacci retracement of the on-going down move from 03 Apr to 29 May 2019 high.
Key Levels (1 to 3 weeks)
Intermediate support: 33.23
Pivot (key support): 31.00
Resistance: 36.90/38.40
Next supports: 28.39 & 26.65
Conclusion
If MU manages to hold at the 31.00 key medium-term pivotal support, it is likely to undergo a potential corrective rebound to target the 36.90/38.40 resistance zone.
On the other hand, a daily close below 31.00 invalidates the corrective rebound scenario for a continuation of the impulsive down move to retest the key 26 Dec 2018 low of 28.39 before targeting the next support at 26.65 (swing low areas of 12 Apr/10 Aug 2017).
Charts are from eSignal
Latest market news
Today 12:54 AM
Yesterday 08:00 PM
May 4, 2024 08:00 PM
May 4, 2024 08:00 AM
Latest Shares market articles

November 2, 2023 01:41 PM

November 1, 2023 01:33 PM

October 31, 2023 01:15 PM

October 31, 2023 10:24 AM