

This is an excerpt from our full Bitcoin 2024 Outlook report, one of nine detailed reports about what to expect in the coming year.
Bitcoin 2023 in Review
As bad as 2022 was for Bitcoin, 2023 was just as good.“History doesn’t repeat, but it does rhyme” as they say, and experienced followers of the cryptocurrency no doubt recognize some similarities with past cycles.
From the ashes of the 2022 implosions of FTX, UST, and Celsius, Bitcoin rose like a phoenix from its lows near $16K to nearly triple to $45K in 2023, bolstered by hopes of a more accommodative macroeconomic environment, clearer regulation, and an imminent spot ETF in the US exposing the asset class to trillions of dollars of investable assets.
Bitcoin 2024 Outlook
With 2022’s crypto “winter” clearly behind us, Bitcoin has entered the most bullish period of its 4-year Halving cycle. For the uninitiated, the amount of new Bitcoin that is paid out to miners is cut in half roughly every four years, decreasing the inflation rate of Bitcoin’s supply and increasing its “stock-to-flow” ratio, a measure of a currency’s “hardness.”
As the chart below – one I’ve colloquially called “The Only Bitcoin Chart You’ll Ever Need” – shows, the cryptocurrency has historically rotated through three stages with remarkable consistency every 4 years:
1. “Crypto Winter” (Bull Market Peak to Bear Market Trough)
• Dec 2013 – January 2015 (58 weeks): -86%
• Dec 2017 – Dec 2018 (52 weeks): -84%
• Nov 2021 – Nov 2022 (54 weeks): -78%
2. “Crypto Spring” (Bear Market Trough to Bitcoin Halving):
• Jan 2015 – July 2016 (78 weeks): +377% trough-to-peak
• Dec 2018- May 2020 (74 weeks): +348% trough-to-peak
• Nov 2022 – Apr 2024 (72 weeks): +191% trough-to-peak (so far)
3. “Crypto Summer”/Mania Stage (Bitcoin Halving to Bull Market Peak):
• July 2016 – Dec 2017 (74 weeks): +2,873%
• May 2020 – Nov 2021 (78 weeks): +615%
• April 2024 - ???: TBD
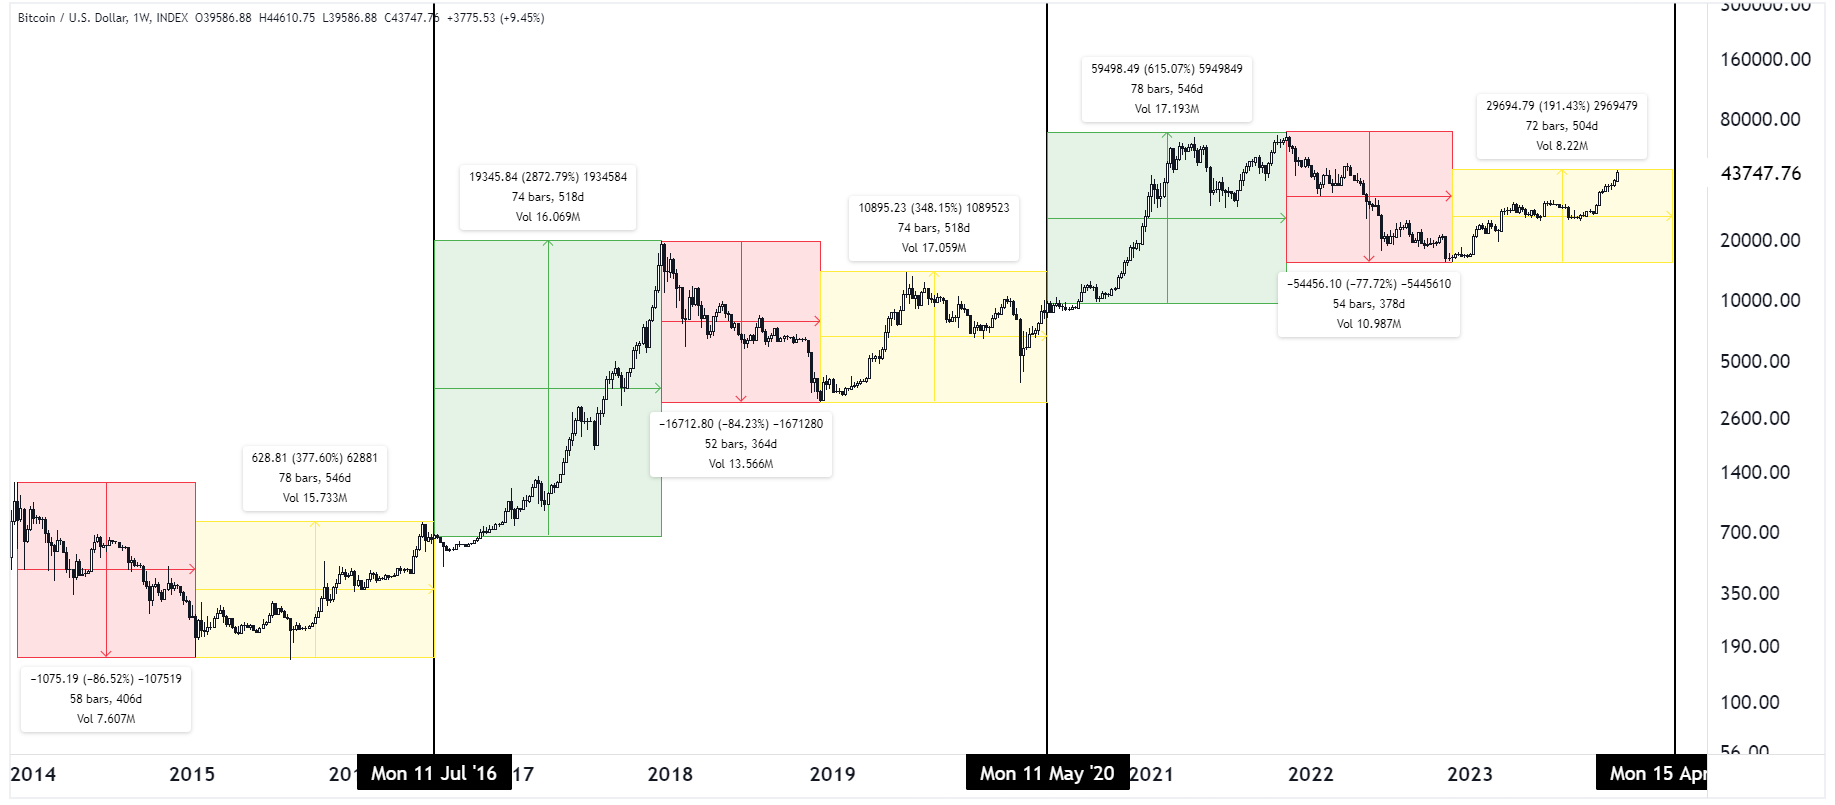
Source: TradingView, StoneX
If this historic pattern holds, it could point both to more potential upside in the first quarter of the year ahead of the Halvings in April, then an acceleration from there if Bitcoin enters another mania stage as we’ve seen after previous Halvings. Of course, past performance is not necessarily indicative of future results, and even if we are in the early innings of another bullish cycle, it’s worth noting that there will likely be bumps along the way. As the chart below shows, previous bull markets in Bitcoin have all seen 40-60% drawdowns before reaching their ultimate peak. Since the bottom late last year, this cycle has only seen a mere -
20% pullback:
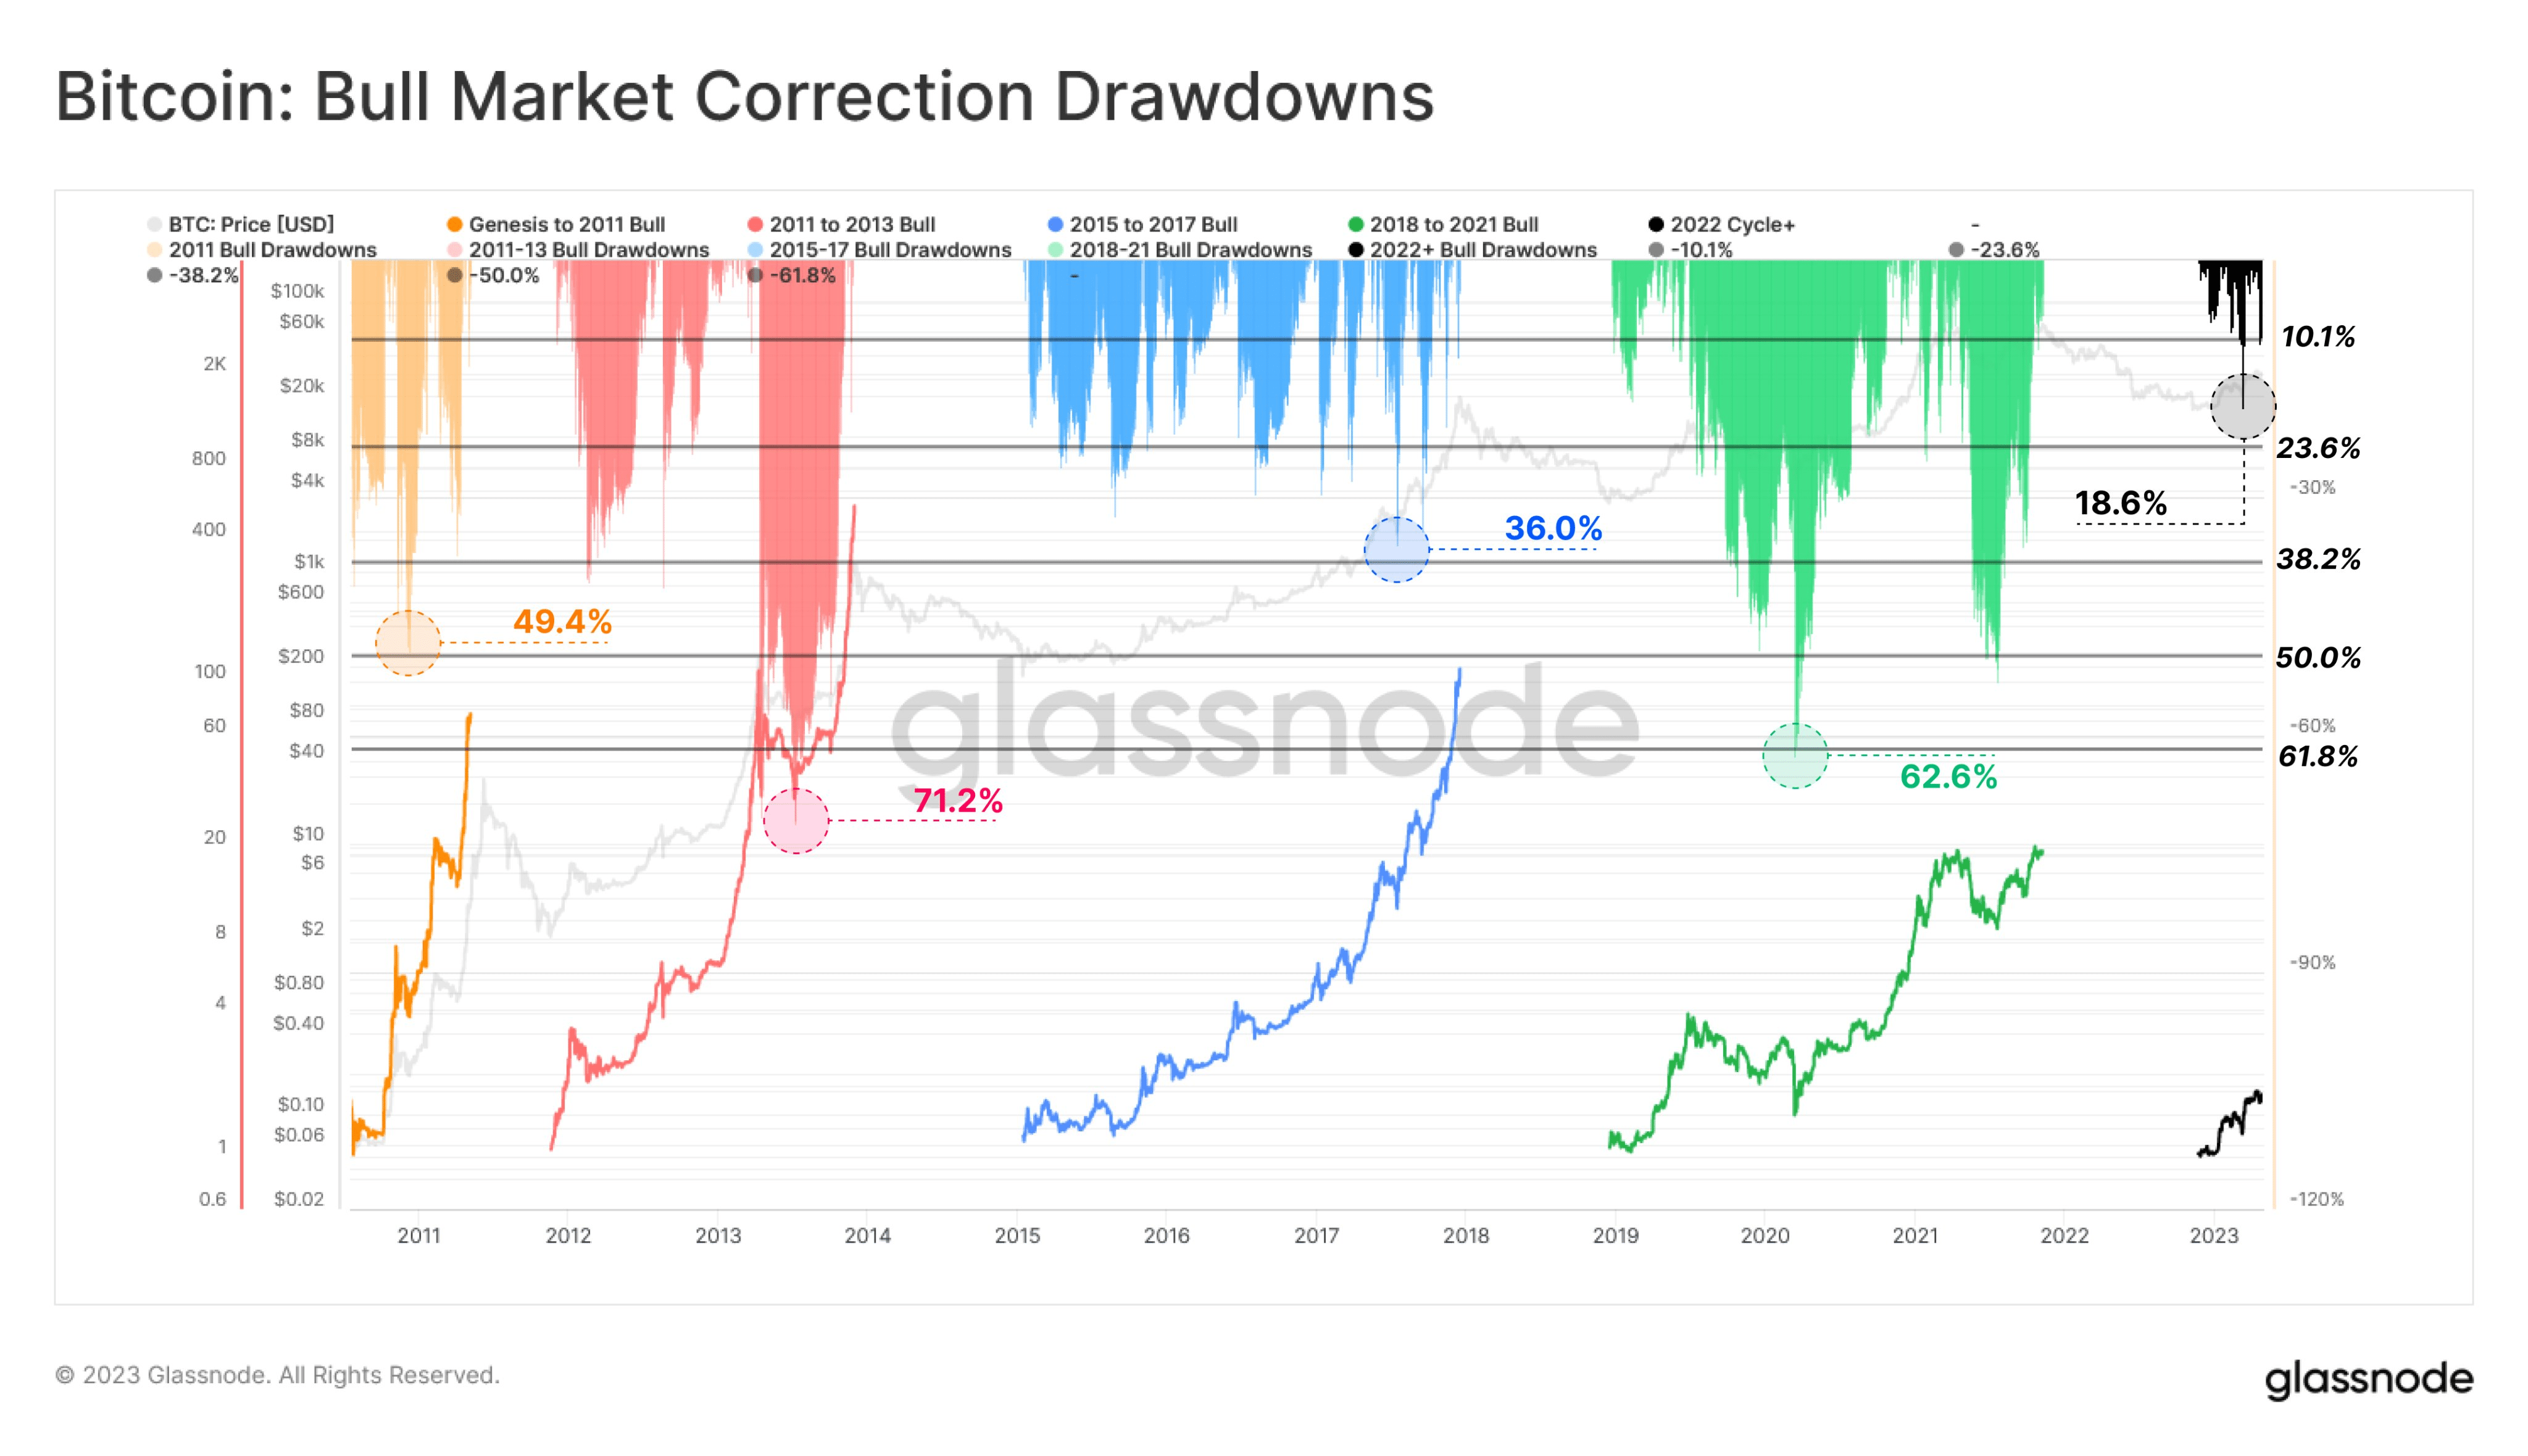
Source: Glassnode
Check out the full Bitcoin guide below, where we look at some potential catalysts that could drive Bitcoin in 2024 and beyond:

Latest market news
Yesterday 01:32 PM
Yesterday 09:35 AM
Yesterday 07:23 AM
Yesterday 04:48 AM
Yesterday 12:17 AM
July 25, 2024 10:39 PM
Latest Bitcoin USD articles

July 20, 2024 07:00 AM


May 23, 2024 01:49 PM

May 21, 2024 06:30 AM