


Beyond Meat (BYND)
click to enlarge chart
Key elements
- Since our last report dated on 12 Jul, Beyond Meat (BYND) has rallied as expected and met the medium-term upside target/resistance of 258.20 as per highlighted (click here for a recap).
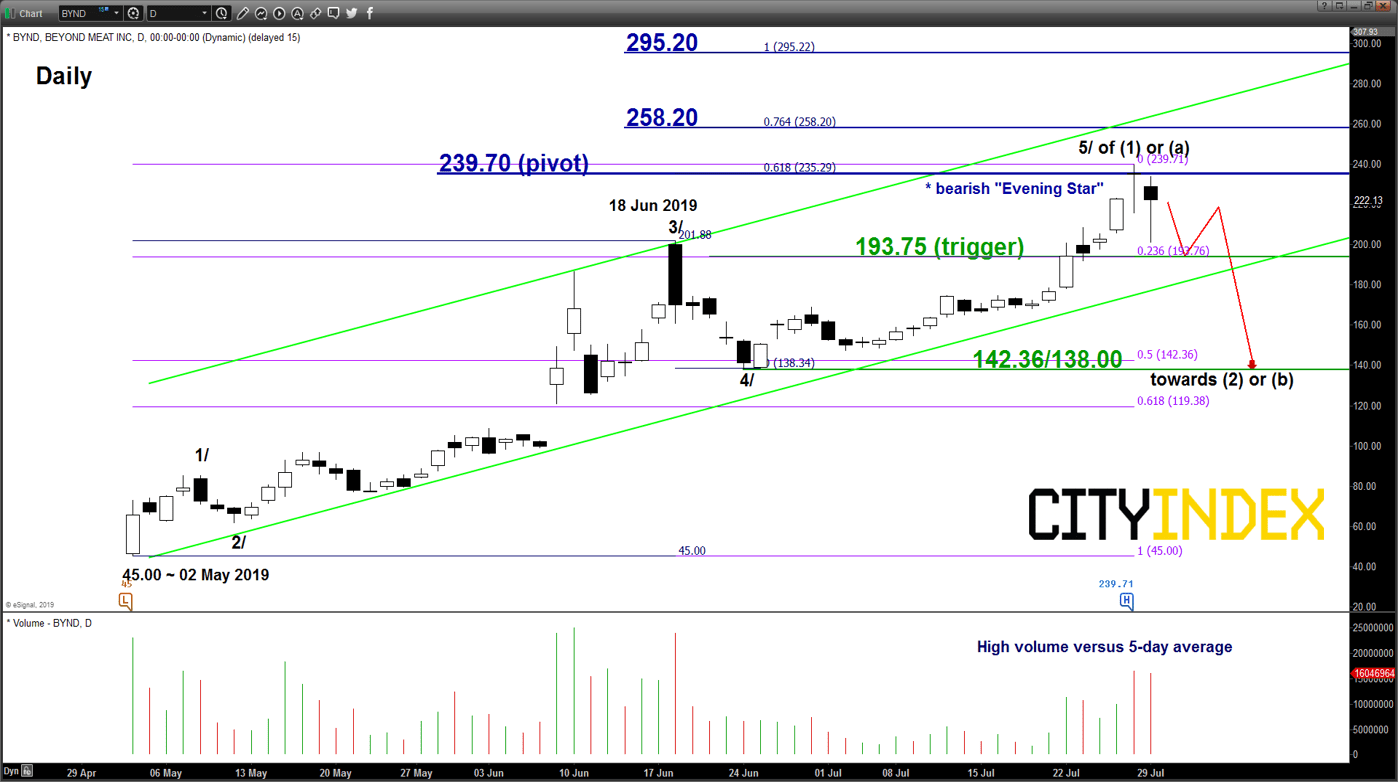
- It printed an intraday high of 239.71 on last Fri, 26 Jul. Thereafter, it has declined by 16% to print a low of 201.00 at the close of yesterday, 29 Jul U.S. session. After the close, BYND has reported better than expected revenue and reinforced its full-year outlook. However, it missed earnings consensus (-$0.24 EPS versus -$0.08 EPS). Also, it has announced a secondary stock offering just three months after is IPO. The share price of BYND continued to tumble by close to 12% in the after-hours session to print a low of 191.00.
- Last three days of price action since 25 Jul, BYND has formed a daily bearish “Evening Star” candlestick pattern right at the 239.70 key medium-term resistance.
- Interestingly, the 239.70 level is predetermined by a Fibonacci expansion level derived from Elliot Wave.
- Last two days of trading has been accompanied by higher volume which tends to be accompanied by a medium-term reversal in price action coupled with the bearish “Evening Star” candlestick pattern.
- Elliot Wave/fractal analysis has suggested that it may have completed the 5th wave impulsive upleg target, labelled as 5/ to complete entire medium-term bullish cycle in place since 02 May 2019 low. Thus, BYND is at risk now of shaping a significant correction of approximately 40% to retrace the prior bullish cycle.
Key Levels (1 to 3 weeks)
Pivot (key resistance): 239.70
Supports: 193.75 (trigger) & 142.36/138.00
Next resistances: 258.20 & 295.20 (Fibonacci expansion levels)
Conclusion
If the 239.70 key pivotal resistance is not surpassed and a break with a 4-hour close below 193.75 (also the ascending channel support) in the U.S. cash trading session is likely to trigger a potential multi-week corrective decline sequence to target the 142.36/138.00 support zone.
However, a clearance with a daily close above 239.70 invalidates the corrective decline scenario for an extension of the impulsive up move towards 258.20 and even 295.20 next.
Chart is from eSignal
Latest market news
Yesterday 03:00 PM
Yesterday 01:12 PM
Yesterday 11:14 AM
Yesterday 08:28 AM
April 24, 2024 03:30 PM
Latest Shares market articles
November 2, 2023 01:41 PM
November 1, 2023 01:33 PM
October 31, 2023 01:15 PM
October 31, 2023 10:24 AM