
S&P500 Forecast: SPX rebounds as big tech recovers & inflation is in focus
Article
Today 2:32 PM


Timing is everything in trading. In this lesson, we explore a few steps that will help you decide when to enter a trade.
There are many different approaches to analysing markets and spotting trading opportunities. But whichever school you follow, there are some time-tested tricks that can help you cut down on entering positions too early or too late.
Here are five tips to improve how you enter your trades, whether they’re on forex, stocks, indices or any other market:
“The trend is your friend” is an old adage in trading – and even if you’re a diehard fundamental analyst, you might find that using trends can improve your success rate.
Ideally, you’ll want to enter the market during a trend as early as possible, to maximise your profit. But spotting and confirming a trend that early on is tricky, so many traders use pullbacks and breakouts instead.
A breakout occurs when a market moves beyond a level of support or resistance that it has previously bounced off. Often, it will then gain momentum as a strong trend – making trading breakouts a hugely popular way of timing your entries.
To start trading with breakouts, you’ll want to follow these three steps.
As we explored back in the technical analysis course, identifying a trend is as simple as plotting a trendline between a market’s higher highs and lower lows. Or alternatively, you might want to use technical indicators to spot trends as they emerge.
Either way, the key here is to also outline the major and minor support and resistance levels that your market will have to pass through on its trend. Plot where they might land, and draw them out on your chart.
Once you have identified the trend, the next step is to look for a pullback.
A pullback is when a previously trending market hits a support or resistance level then quickly reverses – for example, if an asset in a bullish trend hits an area of resistance and starts to fall.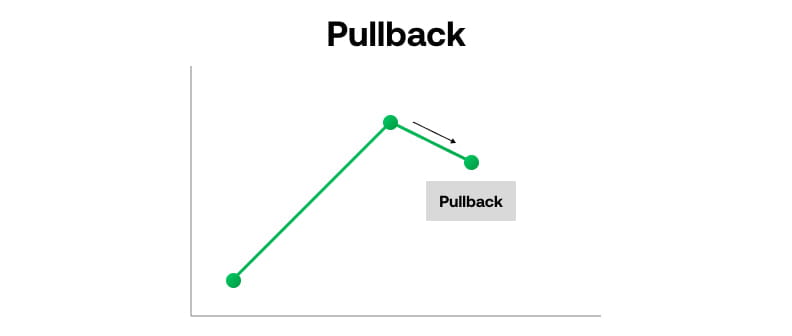
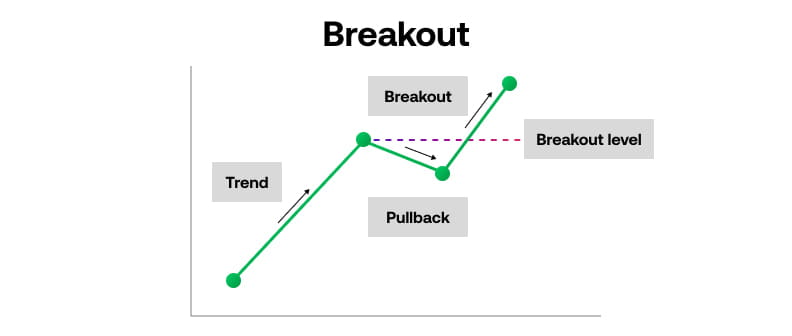
Now it’s time to look for a breakout. This is where the trend resumes its original direction – when short-term momentum moves back in line with the longer-term trend. Crucially, you want the market to break past the support or resistance level that it previously bounced off.
In this example, a suggested entry level might be the blue line above the breakout level. This is when the market has moved beyond the previous level of resistance and will hopefully go on to hit new highs.
By now, you should be placing exit orders on all of your trades – but there’s a strong chance that you aren’t using stop entry and limit entry orders to their maximum potential.
Entry orders can help automate your timing, reducing the risk of you missing the right point to enter a trade – or delaying your entry because of last-minute indecision.
Following our pullback/breakout strategy above, instead of constantly monitoring the market for a pullback then a breakout, you could place an entry order just beyond the support/resistance level. Then, if the breakout does occur, your trade will automatically open.
You can use if/done orders to add stop losses and take profits to your position if it opens.
Before you execute a trade – or set an entry order – it’s always worth double checking your trading plan to make sure that it aligns with your overall strategy.
If anything looks off, then it might be a better idea to leave this opportunity and wait for the next one. Remember, missed profits are far less damaging to your bottom line than realised losses.
One useful thing to consider here are the overall prevalent market conditions as you go to open your position. Individual traders tend to do better in some conditions that others – City Index research, for example, found that 41% of traders perform differently when volatility is high.
Finally, using one or more additional timeframes to double check a trend can help increase your probability of profitable trades.
Say that you’re using a four-hour chart to look for opportunities on Wall Street, and you spot a pullback from a bull run that looks like it might lead to a significant breakout.
You could confirm the broader move by taking a look at a daily chart, to confirm how long the uptrend has lasted – or identify some support and resistance levels in its wider trend.
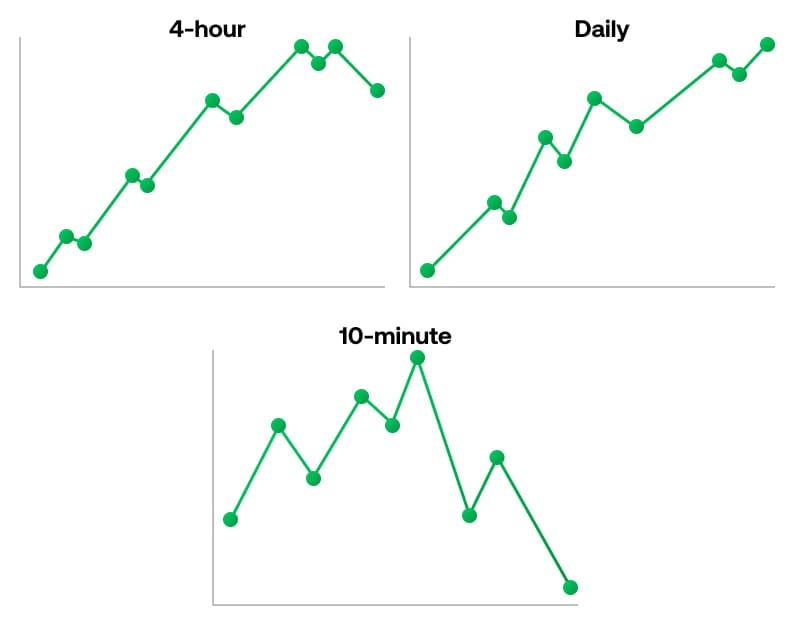
Alternatively, you could hop over to a ten-minute chart and see what is happening on a smaller timeframe. Here, you can check whether buyers or sellers are in charge within the current trading period.
What you want to avoid doing, though, is adding too many different charts into your research, moving between them at random to find opportunities. Instead, stick to a ‘base chart’ that you use to trade, with one or two others for confirming moves.