
S&P500 Forecast: SPX rebounds as big tech recovers & inflation is in focus
Article
Today 2:32 PM


Forex indicators are technical analysis tools which are used to forecast price changes in the forex markets. Traders use forex indicators to aid with trading decisions including identifying trading opportunities, entry levels and exit levels. One of the benefits of forex trading is the ability to trade on rising and falling markets; forex indicators work can be used under all market conditions.
Using a mathematical algorithm on historical data, indicators will help you forecast where the price of that market might go in the future. Indicators often plot lines or other graphical objects on your price charts. In other words, indicators are visual representations of how the price moved in the past, you will then use this information to try to decipher where the price might go in the future.
The best forex indicator is the indicator that best suits your trading style. There is no magic formula. There is no one trading indicator which always produces a profitable trade. Neither is it a case of the more indicators you use, the better. Often new traders will make the mistake of applying too many indicators to their chart. This can result in a chart which is covered in indicators and the most important aspect of the chart, the price action can barely be seen. Instead it is important to learn to use and combine tools to create a trading system that works for you. Remember, there is no one way to trade the forex markets, it takes time a patience and practise to find the right indicators for you.
There are many forex indicators. When you open your chart and click on the indicator button, the extensive list which appears are all indicators which you could apply to your chart.
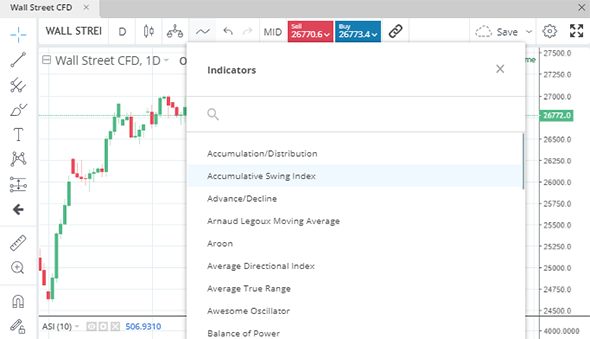
However, it is possible to group the indicators under the following headings according to what they tell you:
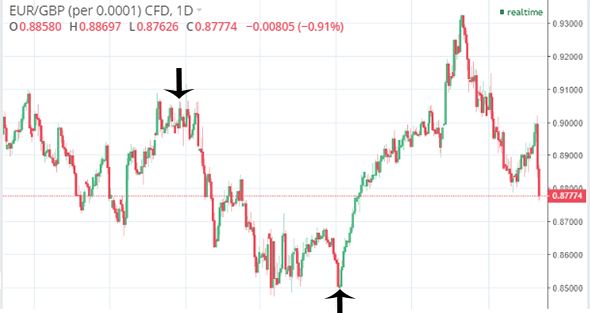
An uptrend is a series of higher highs. A downtrend is a series of lower lows. Trading in the direction of a strong trend can reduce risk whilst increasing profit potential. The purpose of a trend following indicator is to suggest whether you should be going long (upwards trend) or short (downwards trend). For example, through using moving averages. Trend indicators can also change their value depending on the strength of the trend. Other examples include:
Example: Simple Moving Average (SMA) – this is the average price of a specific period of time eg 20-day MA or 200 day MA.
The SMA smooths out the price so it is easier to identify the trend.
This is a lagging indicator.
The greater the time period the slower the market is to respond.
SMA signals a new trend when the long-term average crosses over the short-term average.
A simple trading system would be to use two sma's. You buy when the shorter moving average crosses above the slower MA and you sell when the shorter MA crosses below the slower.
This group of indicators follow the speed of price change during a certain period of time. By measuring the rate of change it is possible to gauge the strength or momentum of the forex pair. Momentum indicators can be used as trend confirmation signals as well as trend reversal signals. The best-known forex momentum indicators include:
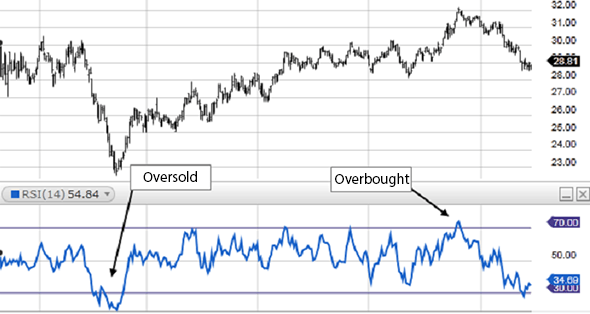
Example: Relative Strength Index – This measure the price movement relative to time, returning a value between 0-100.
The RSI determines overbought and oversold conditions.
An RSI value over 70 indicates an overbought market which could soon come down.
An RSI value under 30 indicates an oversold market which could soon go up.
However, markets can stay over bough or over sold for some time. You shouldn’t base your trading solely on the value of the RSI indicator.
Also trading overbought and oversold conditions is counter trend trading which can be riskier than trading the trend.
The RSI can be a useful tool for setting profit takers. For example, a trader with a long position could consider taking profit if the price reaches the upper band. A trader with a short position could consider taking profit when the price reaches the lower band.
These measure the volatility of a market. This is also known as the relative rate of price movement with a market. If a particular currency pairs moves up and down a lot, it is considered to be volatile. If the price movement is slow and calm, then the market is not volatile. Popular forex volatility indices include:
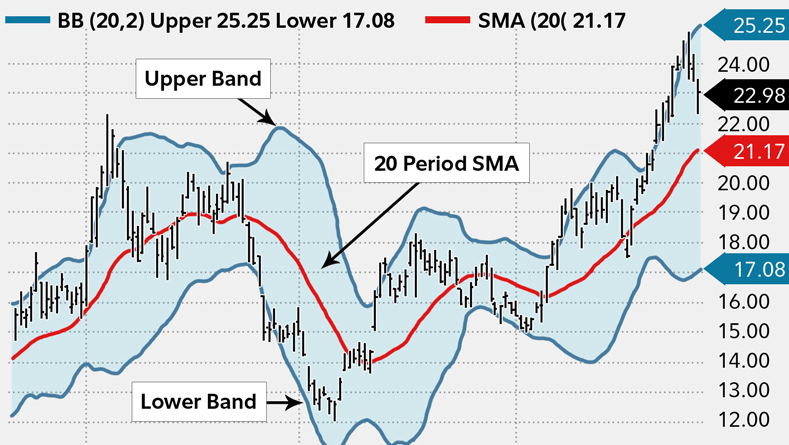
Example : Bollinger band – Any list of the best forex indicators will almost certainly include Bollinger bands. It uses the idea that if the price goes beyond a moving average by an additional amount, a trend may have just started.
A Bollinger band adjusts according to market volatility. As volatility increases it widens. As volatility declines, it narrows.
A long-term strategy could be a system using 2 standard deviations and a 300 day ma. You would take a long position if the previous day’s close was above the top of the channel. You would take a short to open if it was lower than the bottom of the band. The exit point would be wen the previous day’s close crosses back across the moving average.
There are many different indicators. Here we have looked at some of the most popular forex indicators such as moving averages, Bollinger bands and RSI. There is no one right indicator which will always work. The best forex indicator for you is the one that suits your strategy and trading style.