


What to expect from Q3 US airline earnings
Below are some common themes to keep an eye on this week.
Capacity and demand
Capacity continues to steadily recover as the airline industry and travel bounces back from the pandemic. Delta Air Lines, which reported quarterly results covering the three months to the end of September last week, saw the airline return to profit for the first time since the pandemic began as capacity rose to 71% of 2019 levels in the period from just 44% in the previous quarter, and said this should rise to 80% in the last three months of 2021. Below is what each airline is targeting in terms of capacity in the third quarter:
- United Airlines has said capacity will be down around 26% versus 2019 levels.
- American Airlines has said capacity will be 15% to 20% below 2019 levels
- Southwest Airlines has said capacity will recover to comparable levels seen in 2019.
Domestic leisure travel continues to lead the recovery, with business travel bouncing back at a much slower rate, while international travel remains subdued due to international travel restrictions.
Fuel prices and costs
Airlines are facing increased costs as they gradually bring capacity back online, which threatens their ability to generate a profit in the current climate. One of the biggest increases in costs has come from fuel, with costs expected to rise by hundreds of millions of dollars over the coming quarters following the surge in oil prices. For example, Southwest Airlines has warned fuel costs per gallon will be between $2.05 to $2.15 in the third and fourth quarters from just $1.92 in the second.
In normal times, higher fuel costs would typically be passed on to consumers in the form of higher prices. But airlines are fighting for customers and already operating at lower-than-usual capacity, meaning it is much harder to pass on costs and stimulate the market at the same time. Plus, the use of hedging strategies has partly unwound this year after many airlines were stung last year, when many had ordered fuel at a price well above the spot.
Outlook
A return to normal pre-pandemic levels of activity is not expected until 2023 at the earliest, but capacity and demand should both continue to steadily improve going forward. The fact the US plans to open up international travel for all vaccinated passengers from November 8 underpins the industry’s prospects, and this should help buoy the outlook heading into the fourth quarter and into 2022.
United Airlines Q3 earnings preview
United Airlines kicks things off with third quarter earnings out on Tuesday October 19.
Wall Street is expecting total operating revenue of $7.64 billion, which would be up from just $2.49 billion the year before and $5.47 billion in the second quarter as travel rebounds.
United Airlines said it expected to book an adjusted pretax profit in the third and the fourth quarters when it released its last set of results. However, analysts believe United Airlines will remain loss-making with a $542.6 million loss compared to the $3.01 billion loss last year and a $1.60 billion loss in the last quarter. Hopes of escaping the red for the first time since the fourth quarter of 2019 have been scuppered by rising coronavirus cases, increased competition and rising costs – with figures from Bloomberg suggesting it may not book a profit again until the second quarter of 2022.
United Airlines is expected to report a $0.58 loss per diluted share, improving from the $6.33 loss last year and the $1.34 loss booked in the last quarter.
Where next for the United Airlines share price?
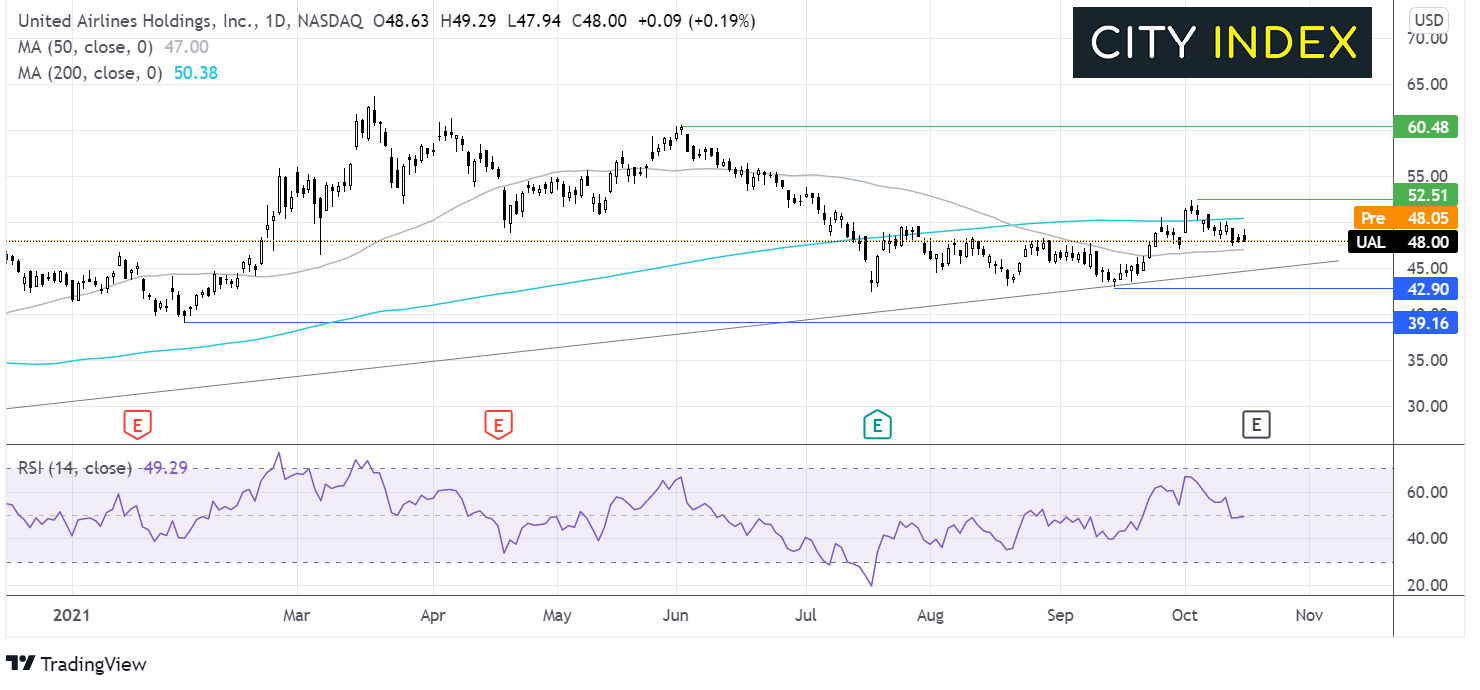
United Airlines trades roughly at the same level that it was at the start of the year. Whilst the price has managed to remain above the gentle rising trend line dating back to May last year, it still trades a good 20% off the year to date high.
The price currently trades above its 50 sma but below its 200 sma on the daily chart. The RSI is giving few clues in neutral position at 50.
Traders might look for a breakout trade with buyers looking for a move over the 200 at $50.38 in order to target the October high of $52.43 and on towards $60.50 the June high.
Meanwhile sells could look for a move below $47 the 50 sma to expose the rising trendline at $44.85 and $42.90 the September low. A move below here could spark a deeper selloff towards $39.16 the year to date low.
American Airlines Q3 earnings preview
American Airlines reports third quarter earnings before the opening bell on Thursday October 21.
Analysts forecast that American Airlines will report $8.94 billion in revenue in the quarter, up from $3.17 billion last year and the $7.48 billion seen in the last quarter. Having squeezed out a $19 million net profit in the second quarter, Wall Street is anticipating the airline slipped back into the red in the third with a $119.3 million net loss.
Analysts are expecting a net loss of $0.51 per share, improving from the $4.71 loss booked a year earlier.
Where next for the American Airlines share price?
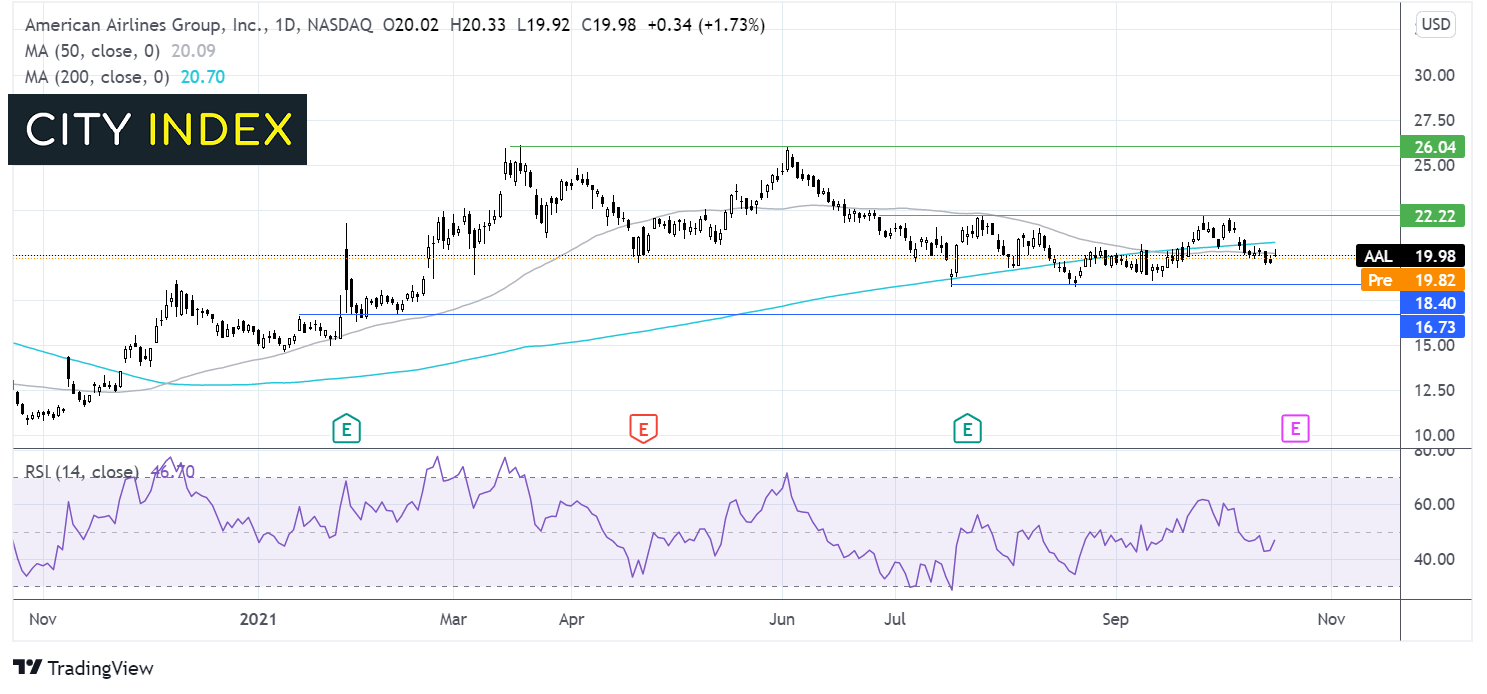
American Airlines has been trading in a holding pattern since early July. The share price has been capped on the upside by $22.30 and on the downside by $18.30.
The price is currently testing the 50 sma and just trades mildly below the 200 sma. The RSI is neutral giving away few clues. The 50 sma has crossed below the 200 sma in a bearish signal.
A breakout trade here would see sellers awaiting a move below $18.30 for a deeper sell off towards $16.75 low February 11, high January 14.
Meanwhile buyers could look for a move over $22.30 the upper band to bring $23.90 swing high May 18 into play.
Southwest Airlines Q3 earnings preview
Southwest Airlines is scheduled to publish third quarter earnings before markets open on Thursday October 21.
Wall Street is expecting Southwest Airlines to report third quarter revenue of $4.59 billion, up from $1.79 billion the year before and climbing from $4.00 billion in the second. Importantly, analysts anticipate Southwest Airlines will book its third consecutive quarter of net profit in the period with forecasts of $100 million, bouncing back from the $1.15 billion loss reported last year but falling from the $348.0 million booked in the second quarter – although it is important to note profits have been underpinned by government financial support. It is forecast to remain in the red on a per share basis with a loss of $0.05.
Importantly, Southwest Airlines was forced to cancel thousands of flights due to unfavourable weather and air traffic control issues earlier this month.
Where next for the Southwest Airlines share price?
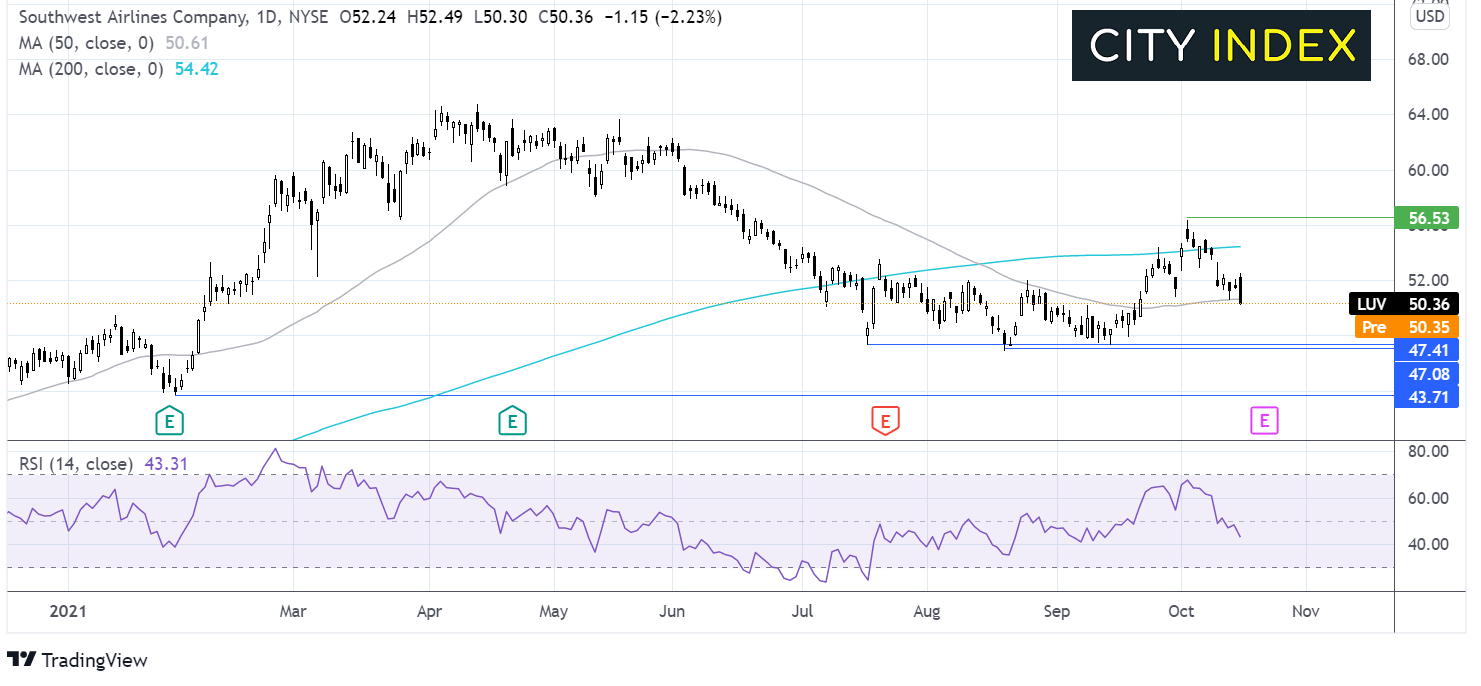
After rising steeply at the start of the year, Southwest airlines ran into resistance at $64.75. The share price consolidated around this level across April and May before trending lower from June.
After a series of lower lows and lower highs the price rebounded off support at $47.00.
Currently the price trades bound by the 200 sma on the upside and is testing the 50 sma on the downside.
The RSI is favoring a bearish bias.
A breakthrough the 50 sma could open the door to $47 the level which has offered support on several occasions across the Q3. A break below here would open the door to $43.71 the year to date low.
On the flipside, should the 50 sma hold buyers could look to retake the 200 sma at $54.42 and $56.50 the October high.
How to trade airline stocks
You can trade airline stocks with City Index in just four easy steps:
- Open a City Index account, or log-in if you’re already a customer.
- Search for the stock you want to trade in our award-winning platform
- Choose your position and size, and your stop and limit levels
- Place the trade
Latest market news
Yesterday 01:32 PM
Yesterday 09:35 AM
Yesterday 07:23 AM
Yesterday 04:48 AM
Yesterday 12:17 AM
July 25, 2024 10:39 PM
Latest Shares market articles

November 2, 2023 01:41 PM

November 1, 2023 01:33 PM

October 31, 2023 01:15 PM

October 31, 2023 10:24 AM