


- USD/JPY analysis: Yen rises as Israel-Hamas conflict “triggers risk off” response
- FOMC minutes, US CPI and UoM Consumer Sentiment among key data
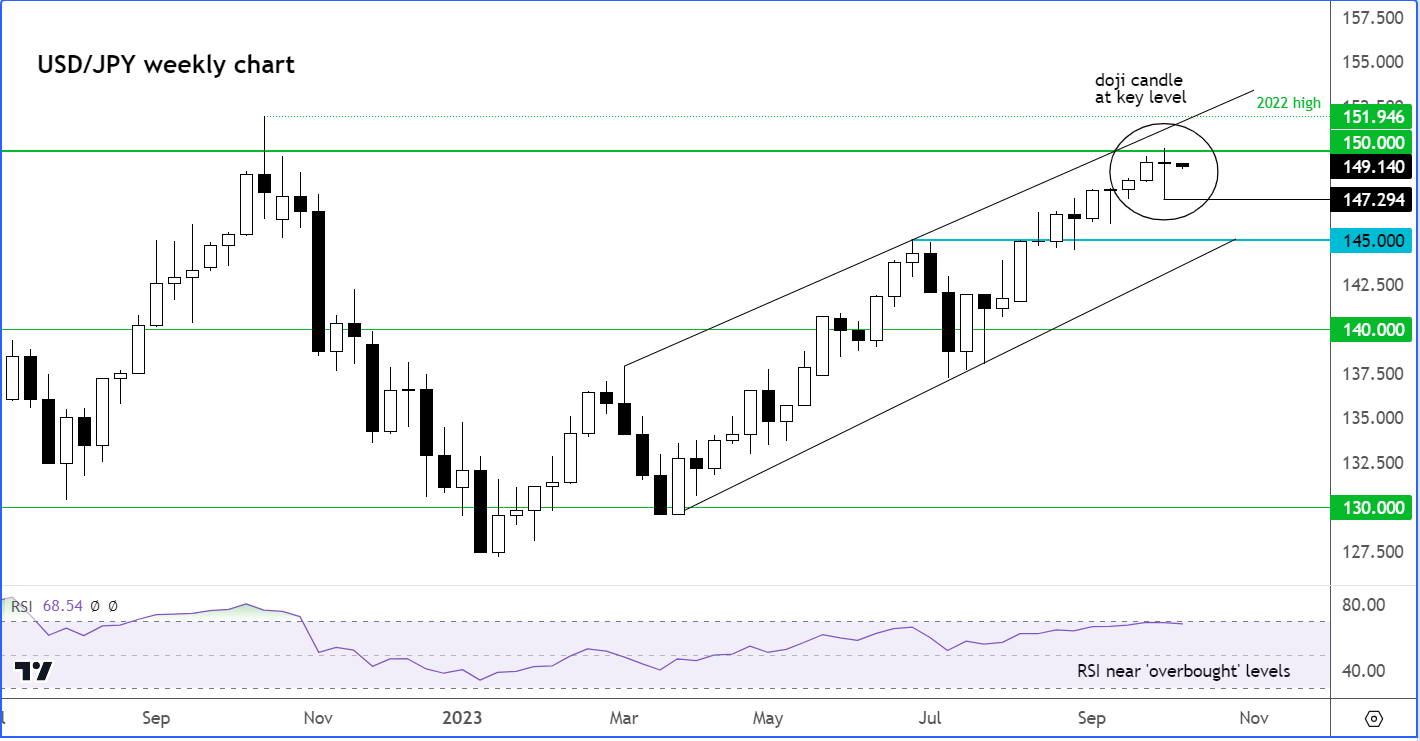
- USD/JPY technical analysis: Weekly doji candle at 150.00 provides bearish signal
With the unfortunate events over the weekend triggering a “risk off” response in the markets, and key US data to come later in the week, both the Japanese yen, still deemed by many as a haven currency, and the US dollar will be in focus this week. Additionally, there is the potential for further Japanese intervention given that the USD/JPY trades not too far from the 150.00 level, where it met some notable resistance, apparently by Japanese authorities, last week.
USD/JPY analysis: Yen rises as Israel-Hamas conflict “triggers risk off” response
The start of the week has been all about the Israel-Hamas conflict, creating gaps at the Asian open for many risk assets, including gold, oil and major indices. Though some of the initial kneejerk reaction to the events over the weekend unwound a little, markets still remined in risk off mode deep into the European session. This kept the USD/JPY under pressure, although the more risk-sensitive GBP/JPY and EUR/JPY were trading even lower, given that the US dollar has also been acting as haven currency of late.
Investors are worried that the retaliation by Israel is going to be – as it has already – severe and will raise the tensions between Israel and many other countries around the region, including, of course, Iran. This is why oil prices have remained elevated after gapping higher. In the FX space, traders are taking refuge in the US dollar and Japanese yen while bond investors have piled into European debt with US Treasurys being closed for trading today.
So, the market’s attention will remain on the Israel-Hamas conflict until at least later in the week, when we have some key US data scheduled for release. As a result, the USD/JPY could remain under a bit of pressure for a change following its recent sharp gains.
Key US data to watch this week for USD/JPY
Apart from a couple of Fed speakers, there are no major data releases scheduled for Monday, meaning the focus will remain on the Israel-Palestine conflict and its implications for risk assets, and by extension the USD/JPY. But after a quieter start to the economic calendar, there will be some key macro pointers to look forward to this week, that will undoubtedly move the USD/JPY. These include the following:
1) FOMC meetings minutes
Wednesday, October 11
19:00 BST
The Fed’s hawkish pause last month sent the dollar surging higher alongside bond yields. At that meeting, the FOMC trimmed their interest rate cut projections in 2024 from 4 to just 2 and left open the possibility of one more rate increase before the end of 2023. As a result, the market was forced to revise higher its prior dovish expectations. The minutes of that meeting will reveal more insights into the Fed’s thinking and thereby help to fine-tune market’s expectations. But how much of that is now priced in? Any hawkish signals from this source is likely to have limited impact on USD/JPY, I would imagine.
2) US CPI
Thursday, October 12
13:30 BST
The market appears convinced that the Fed’s tightening cycle is over, but equally they are not expecting any rate cuts any time soon. This is because macro indicators in the US have remained relatively upbeat compared to the rest of the world. The dollar bulls will be looking for further evidence in incoming data, such as Thursday’s CPI print, to support the Fed’s view in keep rates high for long. Last month, CPI surprised to the upside, rising to 3.7% from 3.2%, ending a 14-month run of falling price pressures. But if there’s renewed weakness observed in CPI then this could alleviate some of the upside pressure on the USD/JPY.
3) UoM Consumer Sentiment
Friday, October 15
15:00 BST
Since the middle of last year, consumer sentiment has generally been improving despite borrowing costs continuing to rise and price pressures remaining elevated. In more recent weeks, concerns over interest rates remaining high for longer in the US has caused lots of volatility in across financial markets. We have seen a sharp sell-off in stocks while bond yields have hit levels last seen before the global financial crisis. If these concerns filter through to the consumer, then spending is likely to fall on non-essential items, potentially causing the economy to come to a standstill. The UoM survey will give us an advanced indication on this front.
The USD/JPY bears would be eying a weaker CPI or consumer sentiment to help turn the tide, while if the numbers are strong then this could provide USD/JPY renewed bullish momentum, although any move back above 150.00 could be met with more intervention from Japan.
USD/JPY technical analysis
Source: TradingView.com
From a technical point of view, the USD/JPY formed a doji candlestick pattern on its weekly chart last week to potentially signal rates may have peaked. Interesting, this pattern was created around 150.00, the same are that had marked the high last year. Then, the USD/JPY had created a high of 151.95 before turning lower, although it never closed above 150.00 on the weekly time frame. The doji candle indicates indecision and can sometimes be found at the top or bottom of major trends. So you shouldn’t take it lightly.
But before we get too bearish based on just one technical pattern, more evidence is needed to confirm the top is in. For example, a break below last week’s low at 147.29 is the minimum requirement on the weekly time frame. But if you trade based on the daily and lower time frames, like most people, then it is best to zoom into price action more closely and find confirmation there.
-- Written by Fawad Razaqzada, Market Analyst
Follow Fawad on Twitter @Trader_F_R
How to trade with City Index
You can trade with City Index by following these four easy steps:
-
Open an account, or log in if you’re already a customer
• Open an account in the UK
• Open an account in Australia
• Open an account in Singapore
- Search for the company you want to trade in our award-winning platform
- Choose your position and size, and your stop and limit levels
- Place the trade
Latest market news
Yesterday 01:39 PM
Yesterday 01:29 PM
Yesterday 12:16 PM
Latest Currency pair of the week articles

April 22, 2024 11:30 AM

April 15, 2024 12:00 PM

April 8, 2024 11:00 AM

March 25, 2024 12:30 PM