


For traders today, it seems the next financial crisis is never too far off. Let’s examine some of the biggest stock market crashes in history – and what we can learn from them.
Crashes, bubbles and flash crashes explained
Before we kick off our timeline of stock market crashes, bubbles and flash crashes, it’s worth covering what we mean by each one – they all refer to slightly different types of financial market chaos.
Stock market crash definition
A stock market crash is a dramatic decline in the prices of the majority of shares. Usually, a few stocks begin to fall in a localised bear market, which then spreads to cover a wide range of assets. Then, investor panic takes over, driving prices further and further down across the entire market.
Learn more about what a stock market crash is.
Financial bubble definition
A financial bubble – also called a stock market bubble – refers to a period where share prices rise rapidly. This bull run has little concrete basis, but as more and more investors join the fray prices rise faster and faster. Eventually, though, the bubble bursts and prices quickly fall.
Often, a bubble precedes a stock market crash. Learn more about stock market bubbles.
Flash crash definition
A flash crash is similar to a stock market crash, but usually more localised and playing out over a shorter period. Flash crashes are often followed by swift recoveries – but by then, massive damage may have already been done.
Flash crashes have become more common in recent years, due to increased usage of automated trading tools.
Financial crisis definition
A financial crisis occurs when a stock market crash spreads across almost every asset class, recessions take hold and deflation gains increased momentum. Often, the contagion spreads around economies and markets – forcing central banks to drastically change monetary policy.
History of stock market crashes
- Dutch tulip bubble: 1637
- South sea bubble: 1720
- Wall Street Crash: 1929
- Black Monday: 1987
- Nikkei crash: 1990
- Dotcom bubble: 2000s
- Global financial crisis: 2008
- S&P E-mini futures flash crash: 2010
- EUR/CHF crash: 2015
- Bitcoin bubble: 2017
- Coronavirus crash: 2020
Dutch tulip bubble: 1637
‘Tulipmania’ is generally agreed to be the first known financial bubble in history, landing almost 400 years ago in the mid-17th century. As you probably guessed, it wasn’t a stock market bubble at all – it was based around Dutch tulips.
In the bubble, Dutch speculators began to drive the price of tulip bulbs up to extreme, never-before-seen levels. By its peak, a single bulb cost around six times the average salary – enough to buy a mansion at the time.
However, many of these bulbs were being bought on credit, with investors borrowing capital to buy bulbs in anticipation that they could sell them on for a profit and pay off the debt. When the bulbs reached untenable prices, those debts couldn’t be serviced and the bubble burst.
Some doubt the severity of the tulip bubble. It certainly doesn’t seem to have had too much effect on the Dutch economy at the time – but has become a famous parable of market excess.
South sea bubble: 1720
Historians may have cast doubt on the strength of Tulipmania, but the second bubble in history was undoubtedly catastrophic – seeing some notable figures (including Isaac Newton) losing a lot of money. It surrounded the South Sea Company (SSC), which was founded in 1711 by the British Government and given a trading monopoly in the Americas.
Expectations were strong that the South Sea Company would be hugely profitable, which meant investors piled into the stock. The SSC also offered a 6% dividend to shareholders, and in 1718 King George became its governor. This saw stock demand ramp up even further.
However, the SSC was nowhere near profitable enough to justify the demand. To keep the good times rolling, those involved with the company encouraged more and more investment, which meant its stock kept rising – despite little fundamentals to fuel growth. This has led some to call SSC the world’s first Ponzi scheme.
Unsurprisingly, the bubble eventually burst, and SSC stock plummeted 80% from its peak of £1000 per share. People were ruined, suicide rates rose and an economic crisis swiftly followed.
Wall Street Crash: 1929
Perhaps the most famous stock market crash in history, the Wall Street Crash occurred in 1929 and devastated the global economy.
In the decade before the crash, the Dow Jones Industrial Average (Wall Street) (DJIA) had grown by around 500% in a long-running bull market. In the crash, it quickly dropped 89% from its peak, erasing all of the gains made in the previous nine years. The Great Depression followed, lasting three and a half years and seeing US unemployment hit 25%.
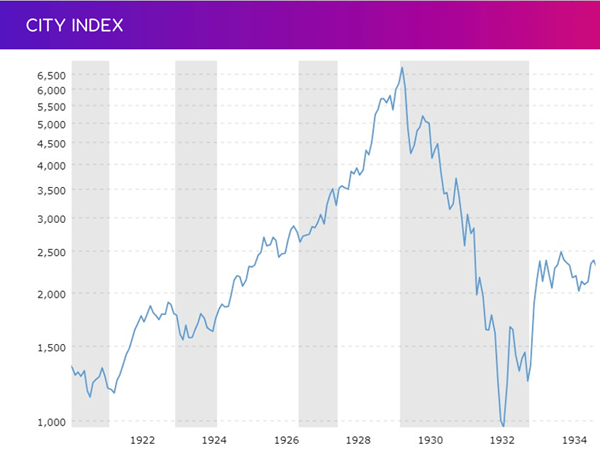
Source: Macrotrends
One key issue behind the Wall Street Crash was a belief that stocks on the New York Stock Exchange (NYSE) would rise forever. As with Tulipmania, credit-fuelled excessive speculation – at one point, more money was loaned to buy stocks than existed as currency. What began as a genuine bull market fuelled by strong fundamentals turned into a bubble that continued growing even as signs of an impending correction grew.
Black Monday: 1987
Black Monday in 1987 saw the DJIA lose 22% of its value in a single day, triggering a global decline across major indices and changing the way financial markets work. In some ways, it was a proto-flash-crash – much of the original decline in the Dow Jones was due to early automated trading programs. However, there was no swift recovery.
Black Monday shocked the markets as it seemed to come out of nowhere. There was no single news event that kicked off the contagion, instead a long bull market swiftly turned into a deep bear run.
Fears over a correction – and general anxiety about global disruption – quickly turned into mass panic, exacerbated by automated trading which created a vicious cycle of selling. After the crisis, measures such as circuit breakers and curbs were implemented to help prevent crashes like it from reoccurring.
As we’ll see, though, the threat of flash crashes certainly didn’t go away.
Nikkei crash: 1990
Less than three years after Black Monday, an even bigger crash took hold in Japan. Up until 1990, the Nikkei had been on a long, 30-year bull run – rising from around 100 points in 1950 to over 35,000 at the end of 1989. It is still yet to get back to that high.
Asset prices – including stocks and houses – had been in a bubble for some time, due in part to loose monetary policy and overextended credit. At the outset of 1990, the stock market bubble burst, and the Nikkei entered a long bear run. By 1992, it had fallen over 40% from its peak, and the contagion had spread to other asset classes too.
The Nikkei crash kicked off Japan’s ‘lost decade’ of stagnating economic growth. Eventually, it led to 0% interest rates and quantitative easing from the Bank of Japan in a radical attempt to reignite the economy.
Dotcom bubble: 2000s
The dotcom bubble burst in the early 2000s but had been growing for years beforehand. The story is familiar – a long bull market gradually turned into a buying frenzy as investors blindly tried to get in on the action. During a five-year period, the Nasdaq 100 (US Tech 100) grew from 750 to more than 5000 points, its growth only accelerating as disaster loomed.
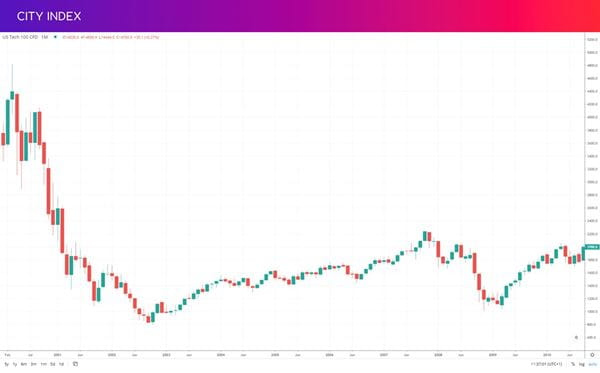
When the bubble burst, the Nasdaq lost almost 80% of its value. Scores of internet companies went completely out of business. The issue was caused by a long-overdue recession arriving in 2001 – by that point, the US economy was on a record run of growth.
Global financial crisis: 2008
The global financial crisis (GFC) of 2007-8 was the worst economic event since the 1929 Wall Street Crash. In many ways, it was a direct follow-on from the dot-com bubble – investors who had fled tech stocks turned straight to homebuilders.
Much like many of the crashes we’ve already covered, the GFC came after a long bull run that buoyed investor confidence. By the summer of 2007, signs of strain were showing – some funds had collapsed, and in the UK Northern Rock needed emergency funding from the Bank of England. Some subprime lenders had also already gone bankrupt.
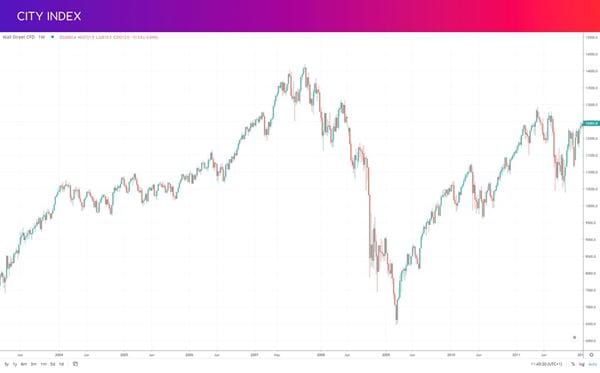
It wasn’t until a year later that the bubble began to burst, however. First, investors realised that popular subprime loan investments weren’t as surefire as they’d believed, and panic set in. Then came the biggest US bankruptcy ever seen: Lehman Brothers.
US indices were tumbling, and the contagion had spread around the world. The ‘Great Recession’ that followed was deep, with some economies taking years to get back to real growth.
The effect of the GFC was particularly strong in one major market: crude oil. Oil prices had been extremely high heading before the crash in 2008 – they dropped from around $145 per barrel in 2008 to just $35 a year later.
S&P E-mini futures flash crash: 2010
May 6 2010 saw a notorious flash crash in the S&P 500 E-mini futures market, which cost the US stock market $1 trillion and was triggered by a single trader: Navinder Singh Sarao. Sarao was found guilty of placing large sell orders that would get cancelled before they were executed (called ‘spoofing’).
Automated trading programs spotted the large numbers of sell orders and responded by adding even more. This caused the market to plummet around 6% in minutes, and while it had recovered within the hour, the S&P 500, Nasdaq and Dow Jones were all affected.
Sarao was a stock trader who worked out of his bedroom in Hounslow, west London. That he was able to reap such havoc shocked commentators at the time – but in 2021, retail traders once again took control of major markets when they initiated a short squeeze on Gamestop among other stocks.
EUR/CHF crash: 2015
Flash crashes often appear out of nowhere, for seemingly no reason. In 2015, however, a rare flash crash occurred that had a direct cause – the Swiss National Bank (SNB) abruptly removing its peg for the Swiss franc against the euro.
Traders were caught unaware by the move, and many had strategies relying on a stable EUR/CHF rate. The pair swiftly dropped at least 13%, and some banks were filling orders below 0.70, a precipitous fall from the peg at 1.20.
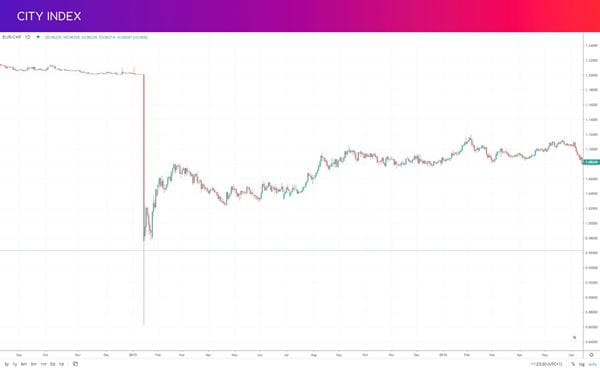
Unlike many flash crashes, there was no quick recovery for EUR/CHF. It took years to get back anywhere close to the 1.2 level – and today trades at below €1.
Bitcoin bubble: 2017
Bitcoin has arguably entered several bubbles since its inception in 2008 – but the most notorious was in 2017, when mass crypto excitement drove the currency’s price from below $700 at the start of the year to nearly $20,000 by December.
By January 2018, the bubble had burst, and Bitcoin retraced 80% of its total gains, bringing almost every other crypto down with it.
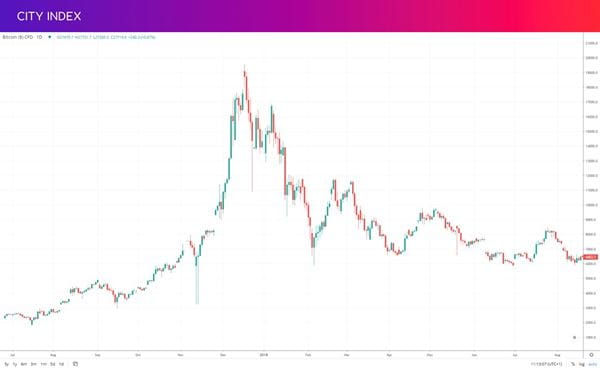
In 2021, it entered bubble territory once again – this time rising to a staggering high of almost $67,000. The subsequent crash wasn’t as severe as in 2018, but BTC had still dropped below $16,000 by the end of 2022.
Coronavirus crash: 2020
The most recent financial crisis arrived in 2020 and is one of the most unusual ever to strike the markets. US stocks had been on a long bull run at the beginning of the year, rising 400% from the lows seen after the 2008 crash. But then, the emerging global pandemic sent panic throughout the markets.
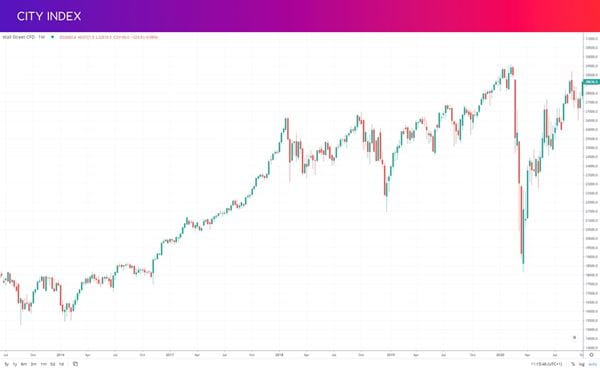
The resulting stock market crash was one of the fastest ever seen. It began on February 20, and after just a month major indices were down almost 40%. Three specific days saw the worst selling:
- March 9, dubbed ‘Black Monday I’, saw the Dow Jones drop 7.8%
- March 12, ‘Black Thursday’, saw it drop almost 10%
- On March 16, or ‘Black Monday II’, it dropped 3,000pts – or almost 13%
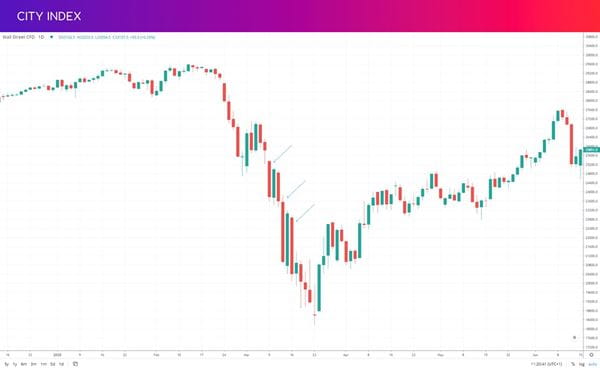
By April, the bear market was over and buying resumed once again. By November, indices were back at January levels. Not only was it one of the fastest drops ever seen – it was one of the fastest recoveries too.
The swift return to growth owed a lot to the actions of the US government and Federal Reserve. A massive fiscal rescue package and quick return to near-zero interest rates helped investors regain their confidence.
Lessons from financial crashes
Examining all the financial crashes, bubbles and crises above, there are some common threads that run through. Often, stocks and other assets are already running too hot, and investor overconfidence quickly turns to fear. With many, there are early warning signs that are ignored.
For some traders, this presents an opportunity to go short and reap huge profits from a crash. However, timing a financial crisis is notoriously difficult. As we’ve seen, markets can run too hot for months or even years before a correction arrives.
Completely unforeseen flash crashes have also increased in regularity in recent decades and are almost impossible to trade successfully. Instead, the traders who do best in these scenarios are usually those with robust risk management strategies in place.
Latest market news
April 25, 2024 03:09 PM
April 25, 2024 03:00 PM
April 25, 2024 01:12 PM
Latest Financial market insight articles
March 26, 2024 04:11 AM

November 13, 2023 11:05 AM

October 25, 2023 01:45 PM

October 25, 2023 07:48 AM