


August 8, 2022 3:17 AM

The S&P500 and the Nasdaq closed lower after Friday’s red hot non-farm payrolls data showed the U.S economy added 528k jobs in July (twice as much as forecast), and the unemployment rate fell to 3.5%.
The strong labour force data likely signals the end (for now) of the “bad news is good news” supportive narrative for equities, with the U.S interest rate market currently 66% priced for a third consecutive 75bp rate hike at the next FOMC meeting on September 21st.
This week there is some significant event risk that can move that pricing either further towards 75bp or back towards 50bp, where the market was sitting after the dovish surprise relative to expectations at the July FOMC.
Those events include a host of Fed Speakers scheduled to hit the wire this week, including San Francisco Fed President Daly, Chicago Fed President Evans, and Minneapolis Fed President Kashkari.
As well as U.S inflation data for July scheduled for release on Wednesday night. Due to a sharp fall in gasoline and energy prices, headline inflation is expected to rise by just 0.2% in July, ensuring the annual headline inflation rate falls to 8.7% YoY from 9.1% in June.
However, core inflation which strips out the volatile price categories of food and energy, is expected to rise from 5.9% to 6.1%.
It is worth noting that even if we were to get flat or zero month-on-month changes between now and December, the annual inflation rate in the U.S would end the year at 6.3%. This means that the market will begin to worry less about inflation and rate hikes.
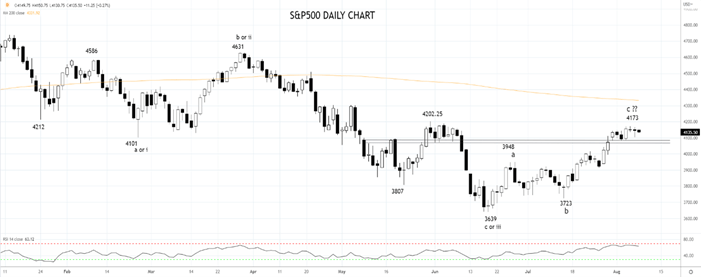
Nonetheless, while the S&P500 remains below the 4200/20 resistance level, the rebound from the 3639 low is viewed as a bear market rally. A break/close below a cluster of recent lows 4080/70ish would be the first sign a top is in place and that a retracement towards June lows is underway.
To take advantage of this, we suggest selling the S&P500 on a stop entry and 4065 with a stop loss placed at 4175. The profit target is 3865.
Source Tradingview. The figures stated are as of August 8th ,2022. Past performance is not a reliable indicator of future performance. This report does not contain and is not to be taken as containing any financial product advice or financial product recommendation
How to trade with City Index
You can trade with City Index by following these four easy steps:
-
Open an account, or log in if you’re already a customer
• Open an account in the UK
• Open an account in Australia
• Open an account in Singapore
- Search for the company you want to trade in our award-winning platform
- Choose your position and size, and your stop and limit levels
- Place the trade
Latest market news
Yesterday 10:19 PM
Yesterday 06:59 PM
Yesterday 04:50 PM
Yesterday 01:18 PM
Latest Indices Monthly Trade articles

February 21, 2024 12:21 AM

February 13, 2024 05:39 AM

January 18, 2024 05:19 AM

October 25, 2023 12:29 AM