


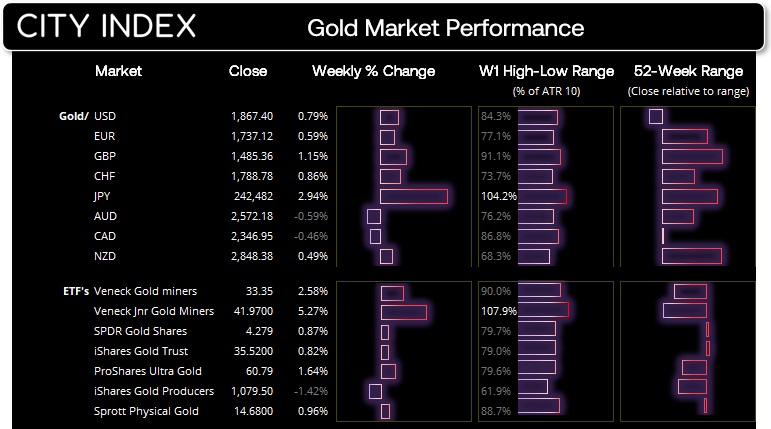


Much like currency trading, we can garner greater confidence in the underlying strength of gold if it is rising against multiple currencies. Over the past five days gold has risen against all major currencies with exception to AUD and CAD, which have rallied alongside commodities. And whilst the weaker yen has allowed gold to dominate the currency, but the fact that gold has risen against 6 or the 8 majors shows it is a story of gold strength as opposed to currency weakness. With that said, XAU/JPY is the only pair to exceed its weekly ATR and it is yet to trade above its 52-week open. But as discussed below, I see the potential for XAU/USD to rise further due to analysis on the weekly and daily charts.
As for ETF’s (Exchange Traded Funds), Junior gold miners have outperformed its gold ETF peers, with only the gold producer ETF notching up a slight loss over the past five days.
How to start gold trading
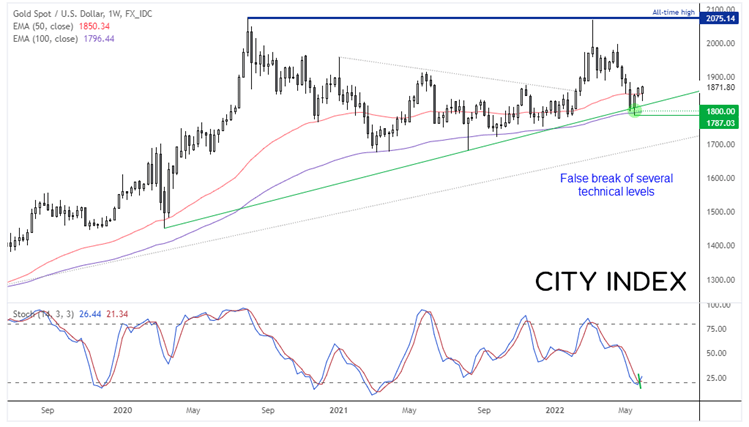
Gold weekly chart:
An important swing low may have been seen three weeks ago, as it marked a false break of 1800, trend support and the 100week eMA. The stochastic oscillator is also on track to generate a weekly buy signal, unless prices fall substantially today. The weekly candle at the low was also part of a 2-week bullish reversal pattern (bullish piercing line). We saw a weekly close above the 50-week eMA last week, and appear set close higher for a third week and produce a bullish outside candle around current levels.
Furthermore, we noted on this week’s Commitment of Traders Report (COT) report that large speculators and managed funds increased their net-long exposure to gold last week, for the first week in six. This ultimately suggests support from deeper pockets at lower levels, and that momentum is now turning higher suggests demand for gold remains in place.
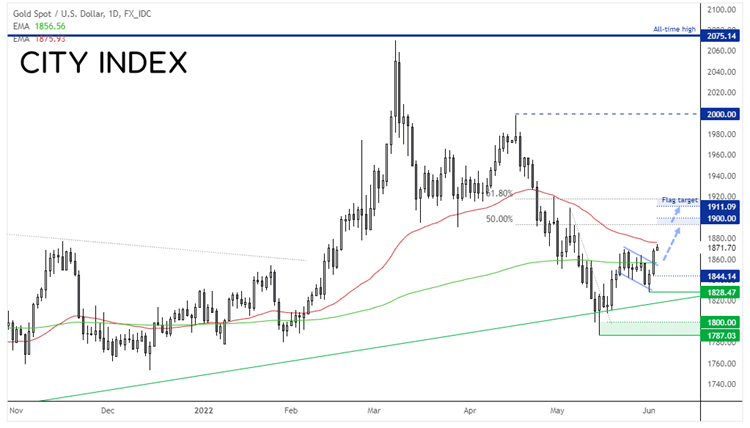
Gold daily chart:
Weak ADP employment and factory order numbers weighed on the US dollar and boosted demand for gold, helping it touch a near one-month high. A soft NFP print today would be the icing on the cake for gold bugs as it would further suggest the Fed have indeed reached ‘peak hawkishness’.
We can see on the daily chart that gold has broken out of a bull flag pattern, which means we may have seen an important low around 1828 this week. And with bullish momentum having returned, a move towards $1900 seems feasible, although the flag projects a target around $1910, just below a 50% retracement level.
Take note that the 50-day eMA is currently capping as resistance, but the flag would remain valid even if prices retrace (and hold above) the 200day eMA first. Barring the unexpected, we could be in for a quiet session ahead of today’s NFP report with China and the UK being on public holidays. But on the flip side of the coin, these lower liquidity sessions can result in a white-knuckle ride should a surprise hit our screens.
How to trade with City Index
You can easily trade with City Index by using these four easy steps:
-
Open an account, or log in if you’re already a customer
• Open an account in the UK
• Open an account in Australia
• Open an account in Singapore
- Search for the company you want to trade in our award-winning platform
- Choose your position and size, and your stop and limit levels
- Place the trade
Latest market news
Yesterday 03:00 PM
Yesterday 01:12 PM
Yesterday 11:14 AM
Yesterday 08:28 AM
April 24, 2024 03:30 PM
Latest XAU USD articles
February 20, 2024 10:27 PM
January 17, 2024 04:29 AM
January 11, 2024 03:49 AM
December 1, 2023 01:16 AM