


Asian Indices:
- Australia's ASX 200 index fell by -94.4 points (-1.38%) and currently trades at 6,732.10
- Japan's Nikkei 225 index has fallen by 248.95 points (-0.9%) and currently trades at 27,377.56
- Hong Kong's Hang Seng index has fallen by -322.51 points (-1.68%) and currently trades at 18,880.22
- China's A50 Index has fallen by -63.89 points (-0.48%) and currently trades at 13,211.60
UK and Europe:
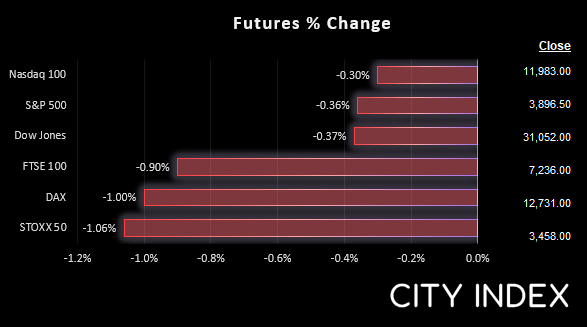
- UK's FTSE 100 futures are currently down -65.5 points (-0.9%), the cash market is currently estimated to open at 7,234.94
- Euro STOXX 50 futures are currently down -37 points (-1.06%), the cash market is currently estimated to open at 3,463.14
- Germany's DAX futures are currently down -128 points (-1%), the cash market is currently estimated to open at 12,743.44
US Futures:
- DJI futures are currently down -116 points (-0.37%)
- S&P 500 futures are currently down -36.5 points (-0.3%)
- Nasdaq 100 futures are currently down -14.25 points (-0.36%)
Sentiment was fragile overnight as China’s trade data disappointed, with both imports (domestic demand) and exports (external demand) falling below par. At 0.3% y/y, imports were their lowest since April and second lowest since August 2020. Exports only rose 7.1%, down from 18% and completely missing expectations of 12.8%.
Asian indices traded lower alongside US and European index futures. WTI also broke a key support level on demand concerns.
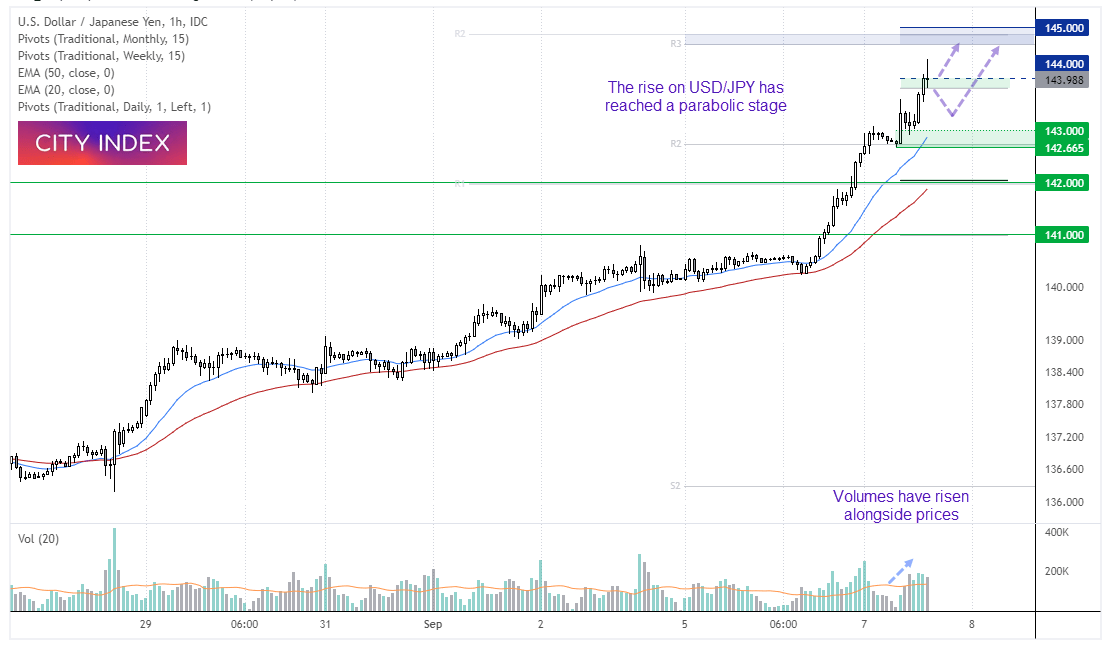
USD/JPY reached 144
Another day, another handle broken for USD/JPY which tapped 144 within the past hour. There was some speculation that the BOJ (Bank of Japan) or MOF (ministry of Finance) may put a stop to the party around 140, but despite a few ignored comments from the MOF traders a simply bidding USD/JPY higher with the potential for a 145 later today.
We can see on the 1-hour chart that USD/JPY has entered a parabolic stage to the trend. The main issue here from a technical perspective is that every ‘classical’ overbought/oversold indicator would have been screaming overbought for some time, and it can stay there for a lot longer. Whilst we continue to see higher lows form, with no evidence of bearish volatility at these highs, the trend is assumed to continue. Bulls could therefore seek bullish setups above 143 should prices retrace with a view to target the 145 area (although take note that the monthly R2 and weekly R3 pivots are just below this ley level).
Economists and money markets divided over size of BOC’s potential hike
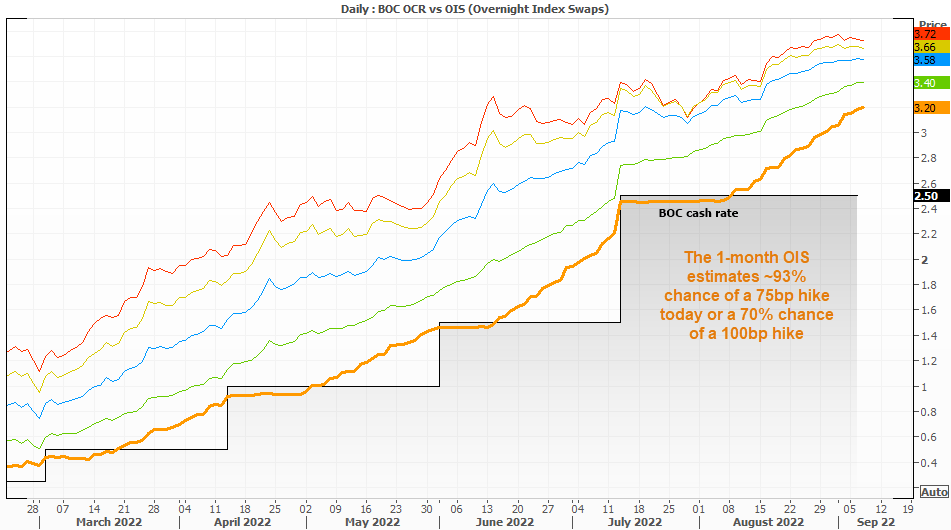
The BOC (Bank of Canada) will be a key focus for traders in the US session, given they surprised markets with a 100bp hike in July when traders were expecting a ‘mere’ 75bp hike). And whilst there is some evidence that headline inflation is beginning to cool, the BOC’s governor was quick to point out that inflation was still “far too high” – which spurred speculation of another 75bp or 100bp hike today.
Economists polled by Reuters favour a 75bp hike, which has been priced in by the 1-month OIS by around 93%. Yet money markets also see a 100bp hike as ‘more likely than not’ with the probability sitting ~70%.
Given these high rates are to fight inflation for which the BOC are currently losing, there’s no guarantee a higher hike will be positive for the Canadian dollar given it is likely to stimmy growth further. And we also have oil prices to contend with, which broke lower overnight.
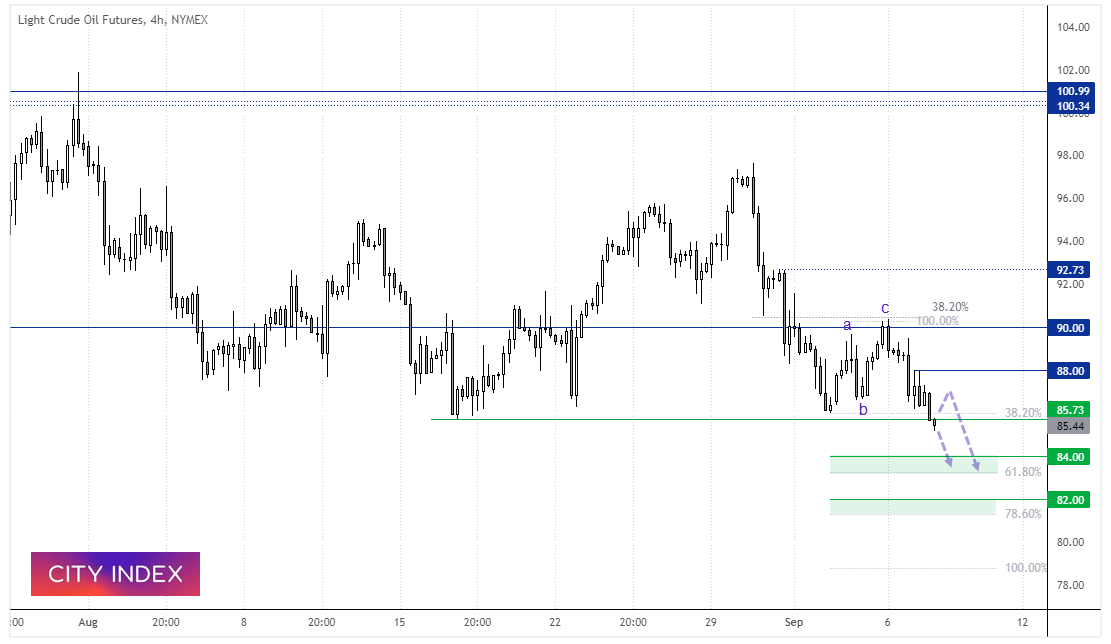
WTI 4-hour chart:
We outlined a potential scenario to retest the lows around 85.70, and that scenario has just played out ahead of the European open. Sentiment remains fragile and unfavourable for risk assets such as oil, so we’re looking for further bearish opportunities below $88 and for a potential move down to the $84 support zone.
FTSE 350 – Market Internals:
FTSE 350: 4041.41 (0.18%) 06 September 2022
- 253 (72.29%) stocks advanced and 86 (24.57%) declined
- 0 stocks rose to a new 52-week high, 8 fell to new lows
- 22.29% of stocks closed above their 200-day average
- 91.14% of stocks closed above their 50-day average
- 3.71% of stocks closed above their 20-day average
Outperformers:
- + 12.91% - Network International Holdings PLC (NETW.L)
- + 8.00% - Countryside Partnerships PLC (CSPC.L)
- + 7.36% - Mitchells & Butlers PLC (MAB.L)
Underperformers:
- -3.92% - Clarkson PLC (CKN.L)
- -3.72% - Energean PLC (ENOG.L)
- -3.54% - Harbour Energy PLC (HBR.L)
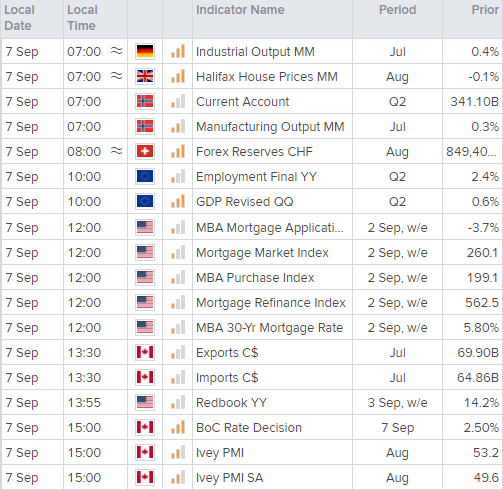
Economic events up next (Times in BST)
How to trade with City Index
You can easily trade with City Index by using these four easy steps:
-
Open an account, or log in if you’re already a customer
• Open an account in the UK
• Open an account in Australia
• Open an account in Singapore
- Search for the company you want to trade in our award-winning platform
- Choose your position and size, and your stop and limit levels
- Place the trade
Latest market news
Yesterday 03:00 PM
Yesterday 01:12 PM
Yesterday 11:14 AM
Yesterday 08:28 AM
April 24, 2024 03:30 PM
Latest FTSE articles
Yesterday 08:28 AM
April 23, 2024 08:18 AM
April 10, 2024 08:46 AM
March 27, 2024 09:37 AM