


The DAX remains in an uptrend on the daily chart and trades within a bullish channel. Whilst this suggests it could continue higher, we see the potential for a deeper pullback before its rally resumes.
The DAX printed a fresh record high on Friday, but it was short lived. Come Monday, the DAX not only gapped lower but opened beneath the 2021 high and effectively marked the high for the day. A notable drag on the index was Sartorius AG which fell over -15% as the company cut its revenue and margin forecasts. But traders are also likely erring on the side of caution ahead of Jerome Powell’s testimony to congress on Wednesday, and may feel less compelled to be loading up on longs so near the record highs. And that could keep the index under pressure and pour cold water on hopes of a new record high over the next couple of sessions.
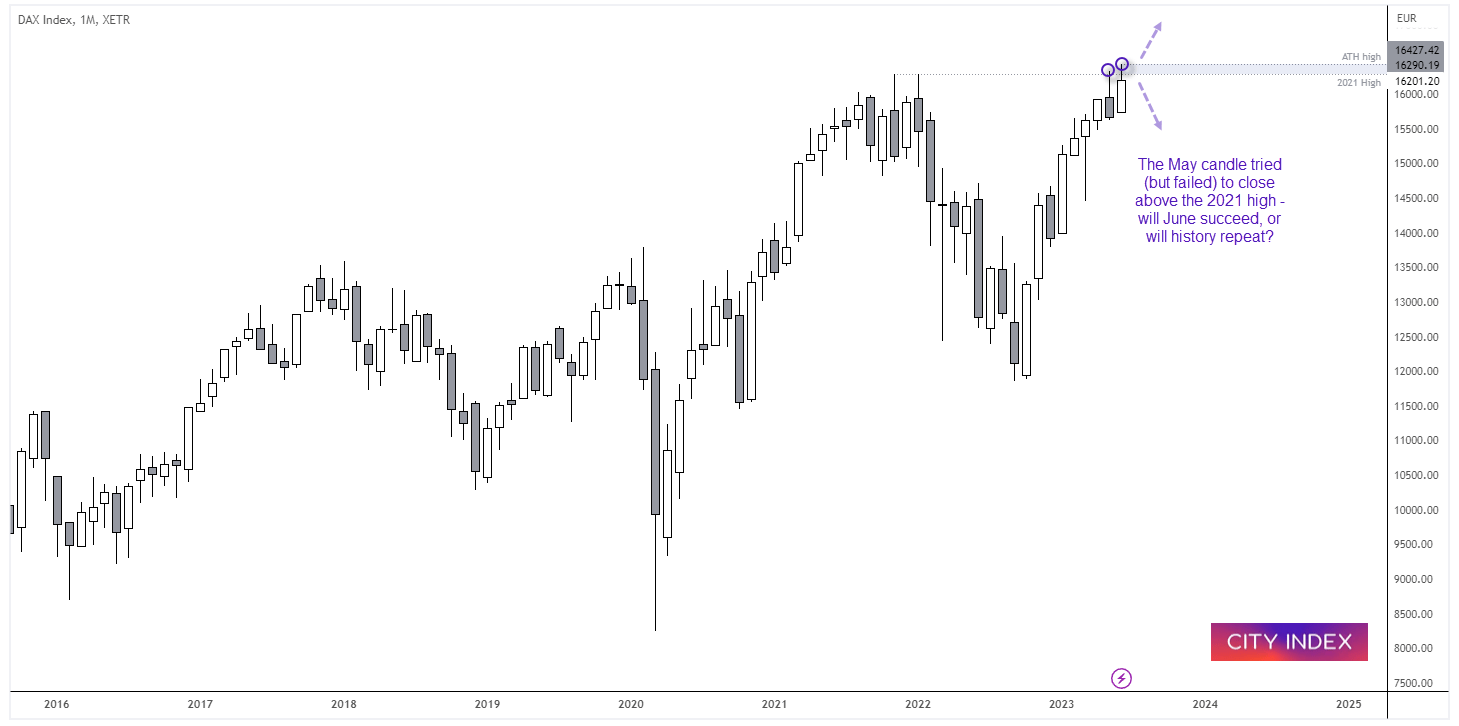
DAX monthly chart:
If we stand back to admire the view, we can see that the May candle tried (but failed) to close above the 2021 high. With less than two full weeks of June left, the DAX is also on track to repeat a failed close above that key high. Of course, that is plenty of time to see a decisive move. But if the DAX closes convincingly beneath 16,000 it would leave a bearish hammer on the monthly charts, and traders might be entering July with a very grim view for the index.
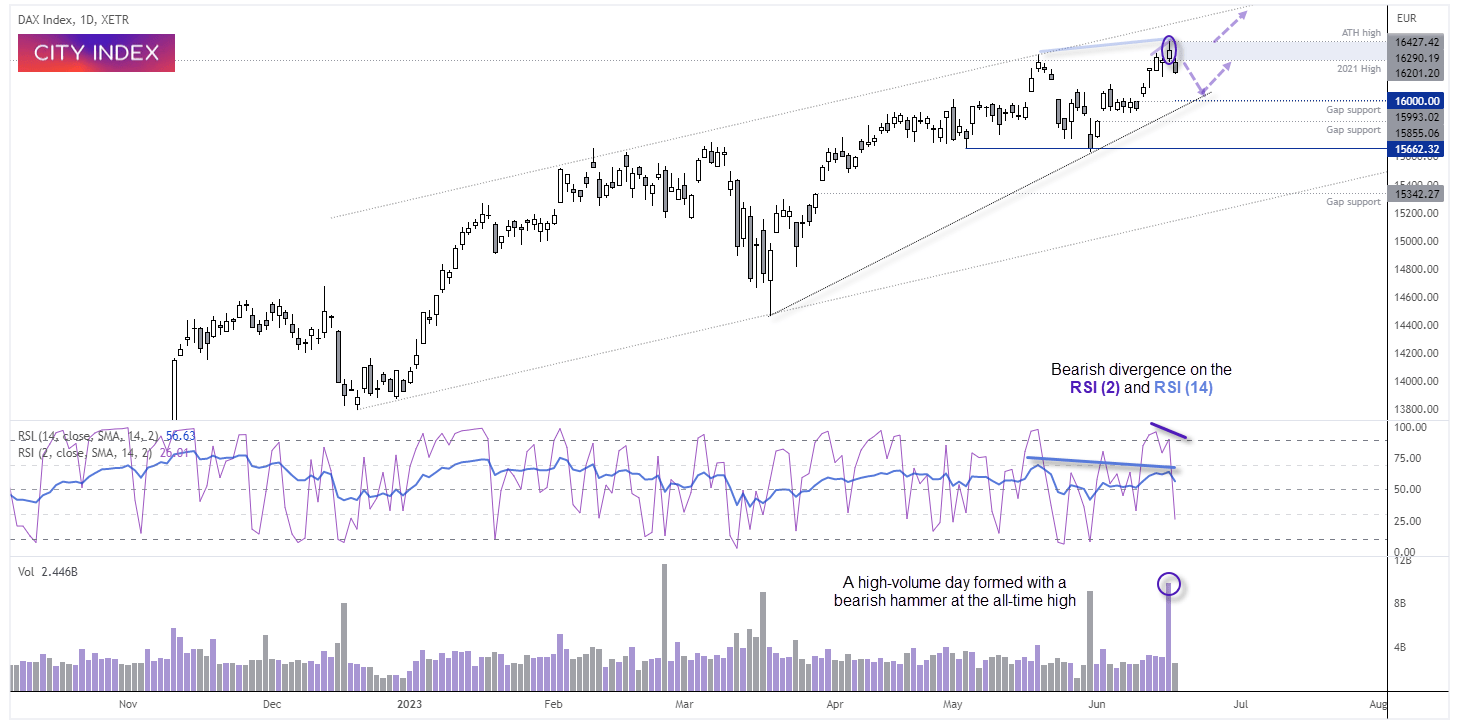
DAX daily chart:
The DAX trades in the upper half of a bullish channel on the daily chart, although recent price action warns of a deeper pullback from its all-time high (ATH). Friday’s upper wick accounts for around half of the day’s range which means bulls handed back half of the day’s gains after reaching a record high. Furthermore, that is happened on very high volume suggests a ‘change in hands’ occurred around those highs as we headed into the weekend.
The weekend gap has since been filled and Monday’s high respected the 2021 high as resistance. And as a bearish divergence has formed on the RSI (14) and RSI (2), we’d consider bearish setups over the near-term.
If prices correct lower, support might be found around 16,000 near gap support, and bears could consider fading into the 2021 high and seek evidence of a swing high on lower timeframes. At which point we would be seeking evidence of a swing low and monitor its potential for a break to new highs.
-- Written by Matt Simpson
Follow Matt on Twitter @cLeverEdge
How to trade with City Index
You can trade with City Index by following these four easy steps:
-
Open an account, or log in if you’re already a customer
• Open an account in the UK
• Open an account in Australia
• Open an account in Singapore
- Search for the market you want to trade in our award-winning platform
- Choose your position and size, and your stop and limit levels
- Place the trade
Latest market news
Today 05:56 AM
Yesterday 11:57 PM
Yesterday 08:00 PM
Yesterday 02:00 PM
Latest Indices Monthly Trade articles

February 21, 2024 12:21 AM

February 13, 2024 05:39 AM

January 18, 2024 05:19 AM

October 25, 2023 12:29 AM