
S&P 500 – Rallied up towards major risk zone
click to enlarge charts
Key Levels (1 to 3 weeks)
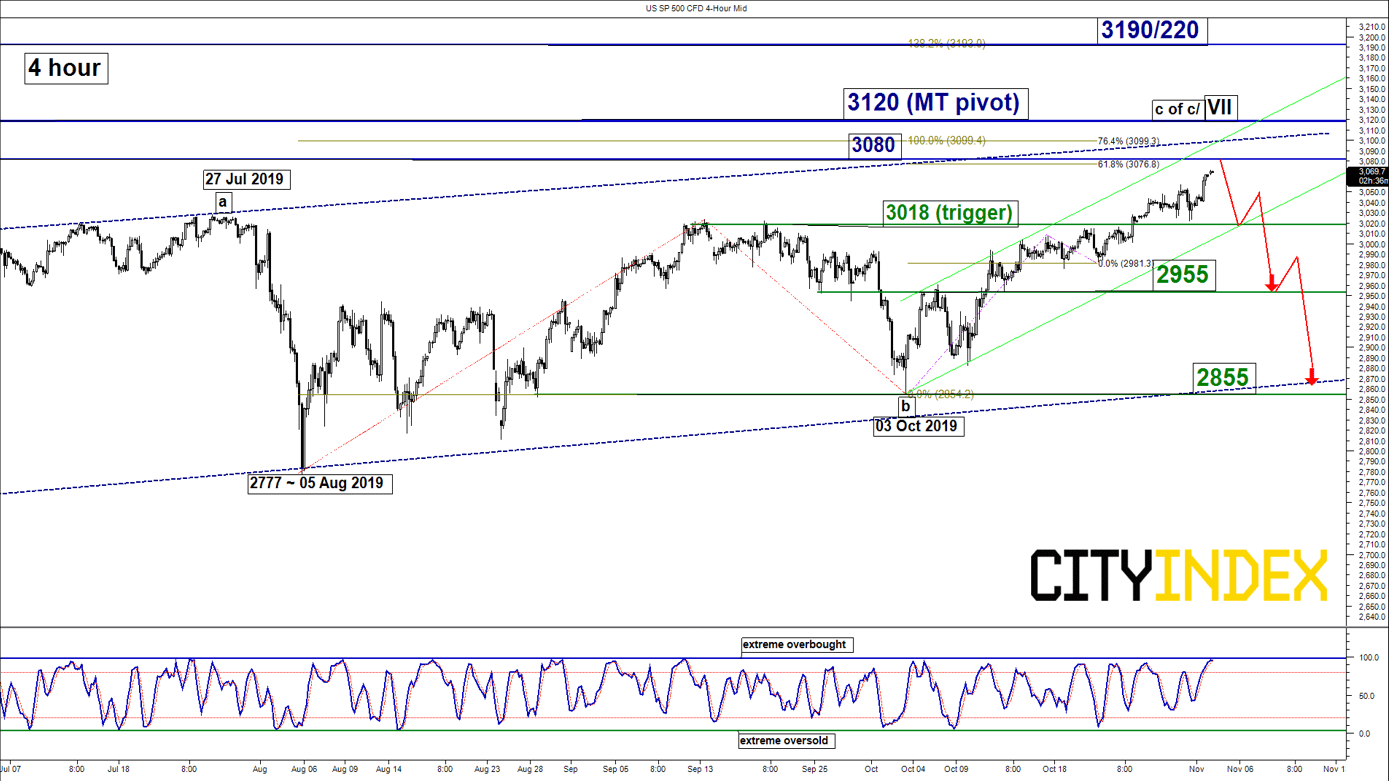
Intermediate resistance: 3080
Pivot (key resistance): 3120
Supports: 3018, 2955 & 2855
Next resistance: 3190/220
Directional Bias (1 to 3 weeks)
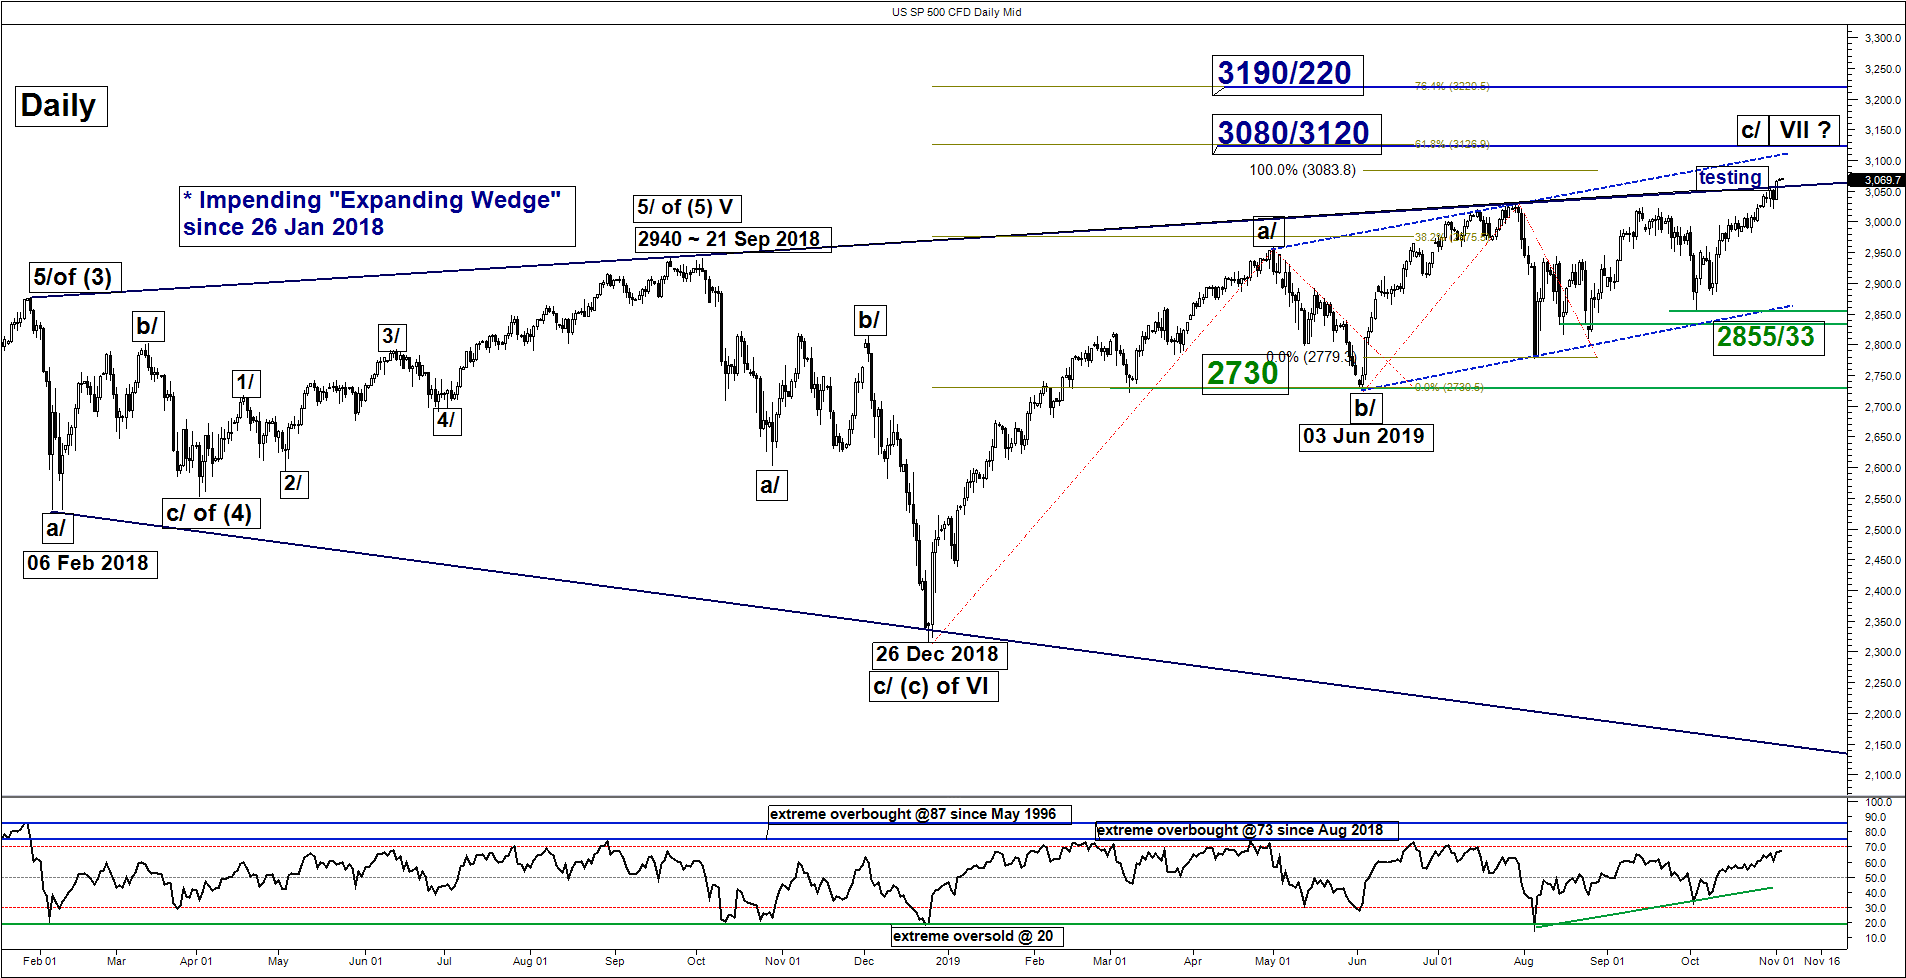
The SP 500 Index (proxy for the S&P 500 futures) has continued to push higher and hit another fresh all-time high of 3067 on last Fri, 01 Nov on the backdrop of robust U.S. job data/non-farm payrolls for Oct.
The Index is now fast approaching the upper limit of a major risk zone at 3080, flip to a bearish bias in any further uptick below 3120 key pivotal resistance and a break below 3018 downside trigger reinforces the start of a potential multi-week corrective decline towards 2955 and 2855 next.
However, a clearance with a daily close above 3120 invalidates the bearish scenario for an extension of the rally towards the next resistance at 3190/220 (Fibonacci expansion cluster).
Key elements
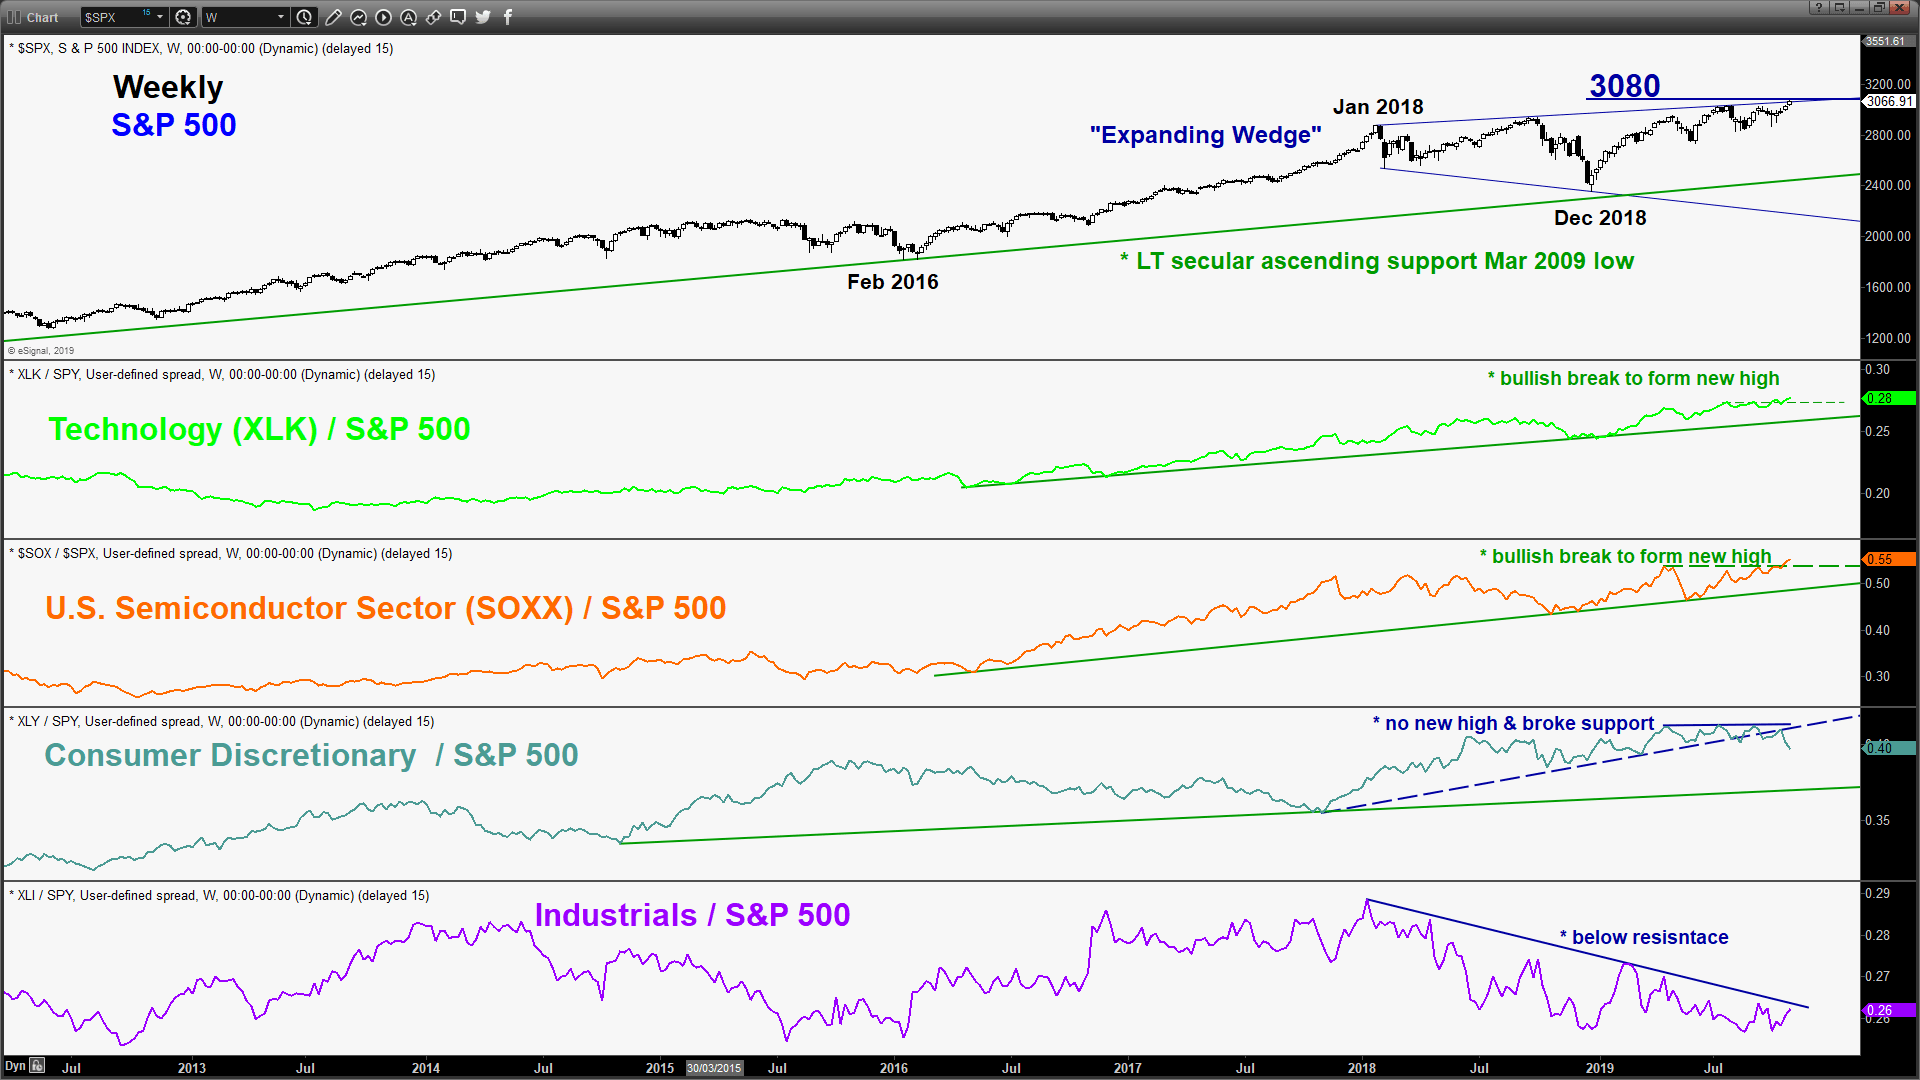
- The Index is now testing the major “Expanding Wedge” upper limit now acting as a resistance at 3080.
- Both the daily RSI and 4-hour Stochastic oscillators have reached overbought regions that increase the risk of a mean reversion decline.
- The 3120 pivotal resistance is defined by the upper limit of the ascending range configuration from 03 Jun 2019 low and the 0.618 Fibonacci projection of the up move from 26 Dec 2018 low to 01 May 2019 high projected from 03 Jun 2019 low.
- Relative strength analysis from the ratio charts suggest that the other two major cyclical sectors; Consumer Discretionary and Industrials have continued to underperform the S&P 500.
Nikkei 225 – 23450 remains the key resistance to watch
click to enlarge charts
Key Levels (1 to 3 weeks)
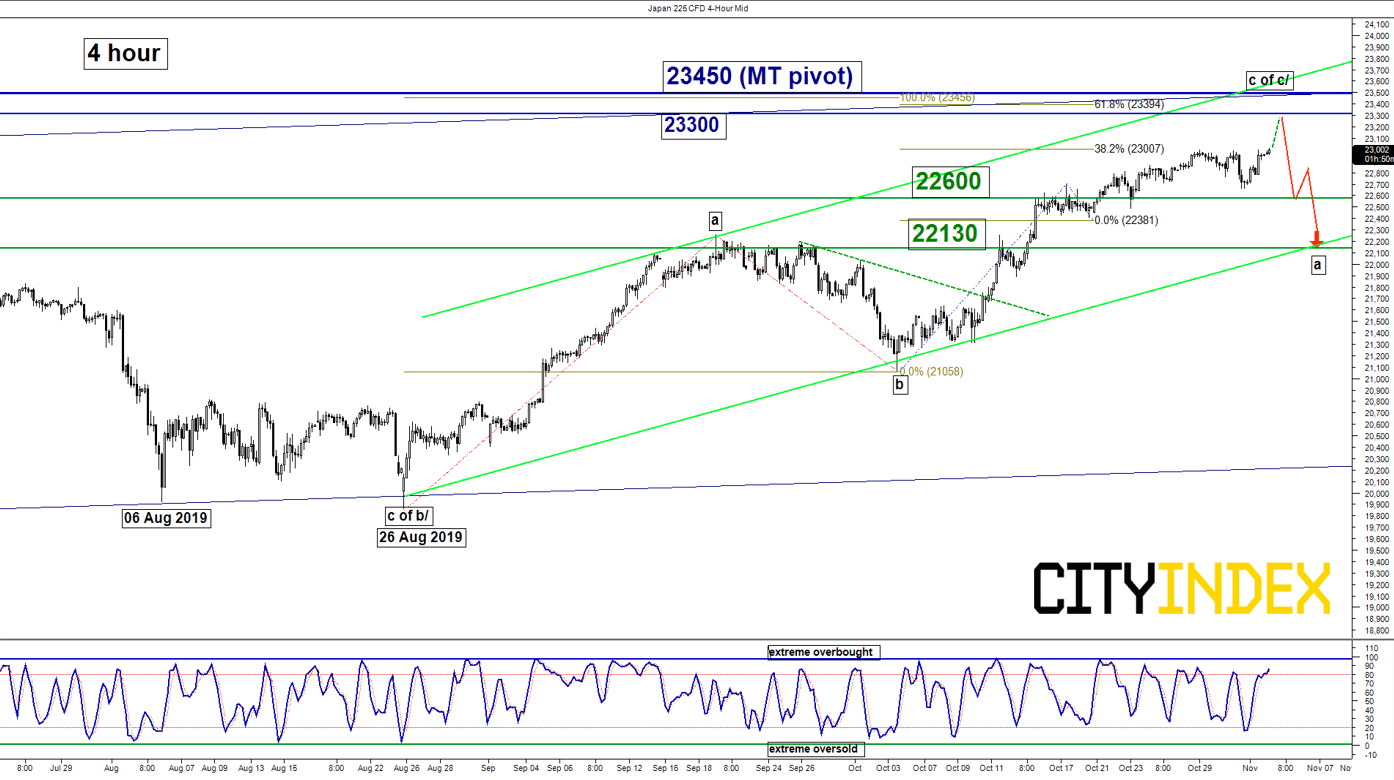
Intermediate resistance: 23300
Pivot (key resistance): 23450
Supports: 22600 & 22130
Next resistance: 24400
Directional Bias (1 to 3 weeks)
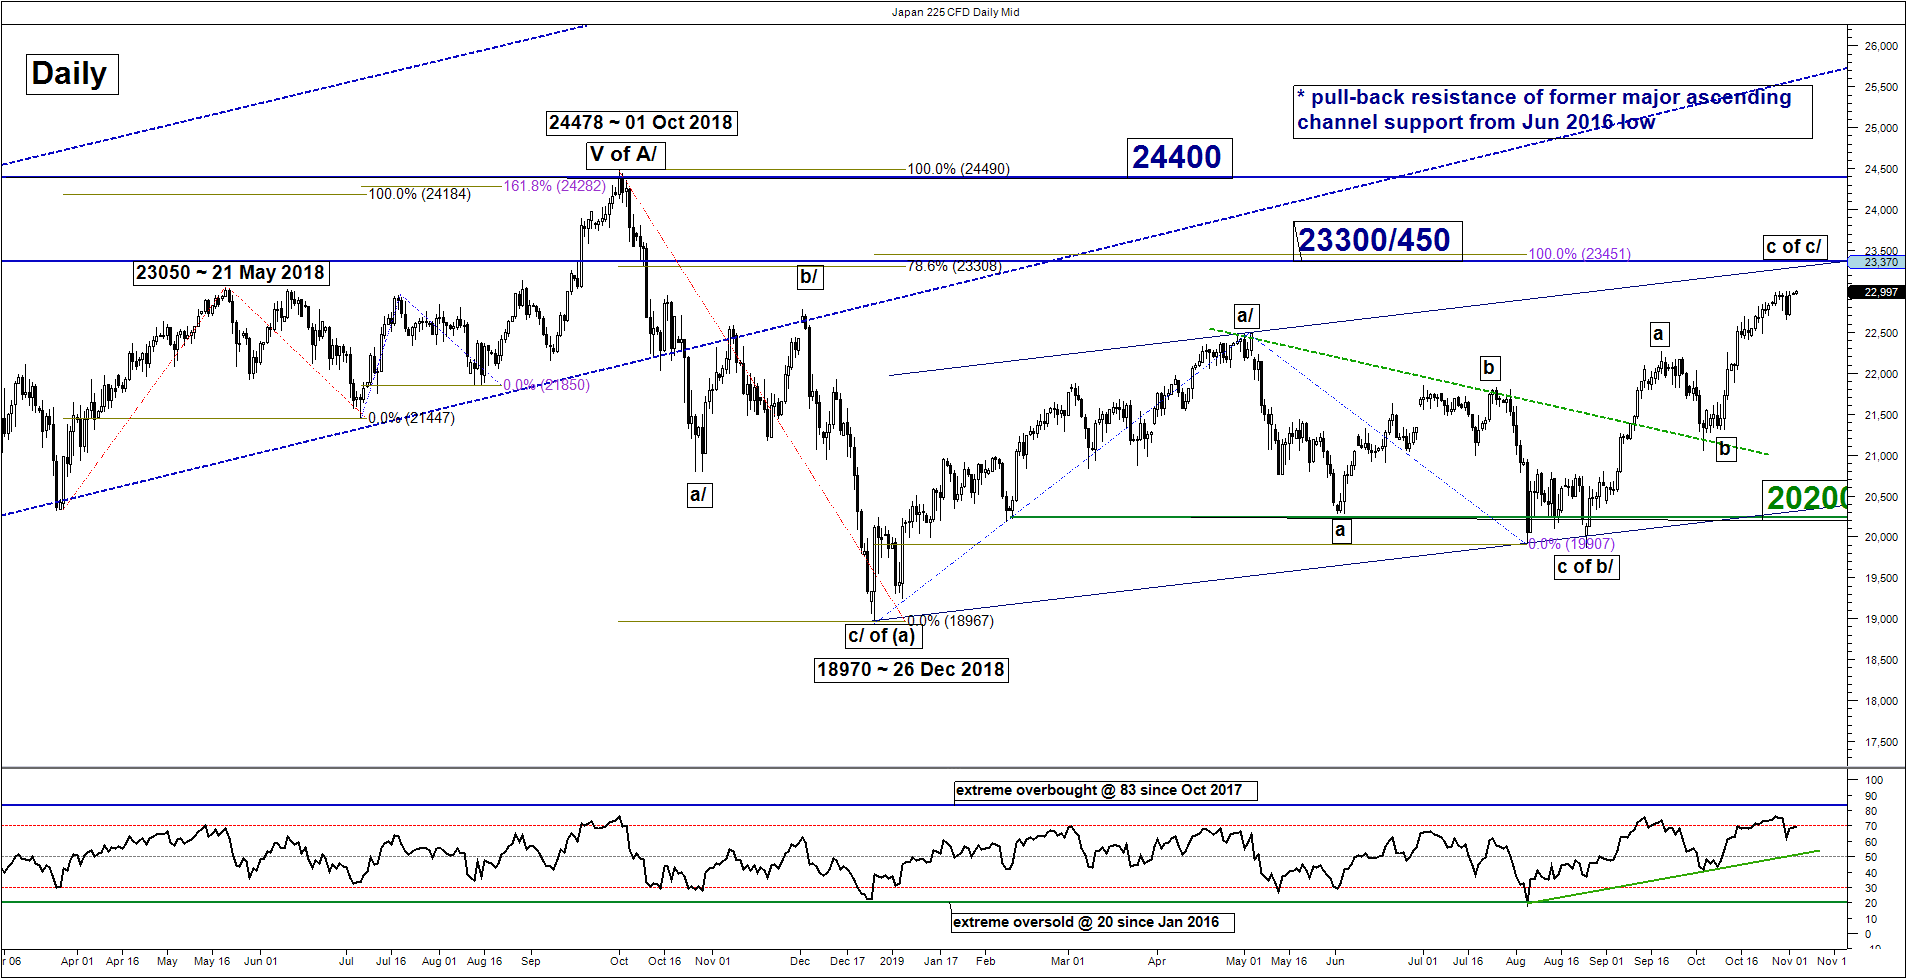
The Japan 225 Index (proxy for the Nikkei 225 futures) has continued to inch upwards as expected and right now is coming close to the 23450 medium-term pivotal resistance as per highlighted in our previous report (click here for a recap).
No major changes on its key elements; maintain bearish bias for a residual push up towards 23300 with a maximum limit set at the 23450 key medium-term pivotal resistance for a potential multi-week corrective decline to target 22600 follow by 22130 support next (also the lower boundary of the minor ascending channel from 26 Aug 2019 low).
However, a clearance with a daily close above 23450 invalidates the bearish scenario for an extension of the up move towards the next resistance at 24400 (01 Oct 2018 major swing high area,
Hang Seng – Corrective rebound extends
click to enlarge charts
Key Levels (1 to 3 weeks)
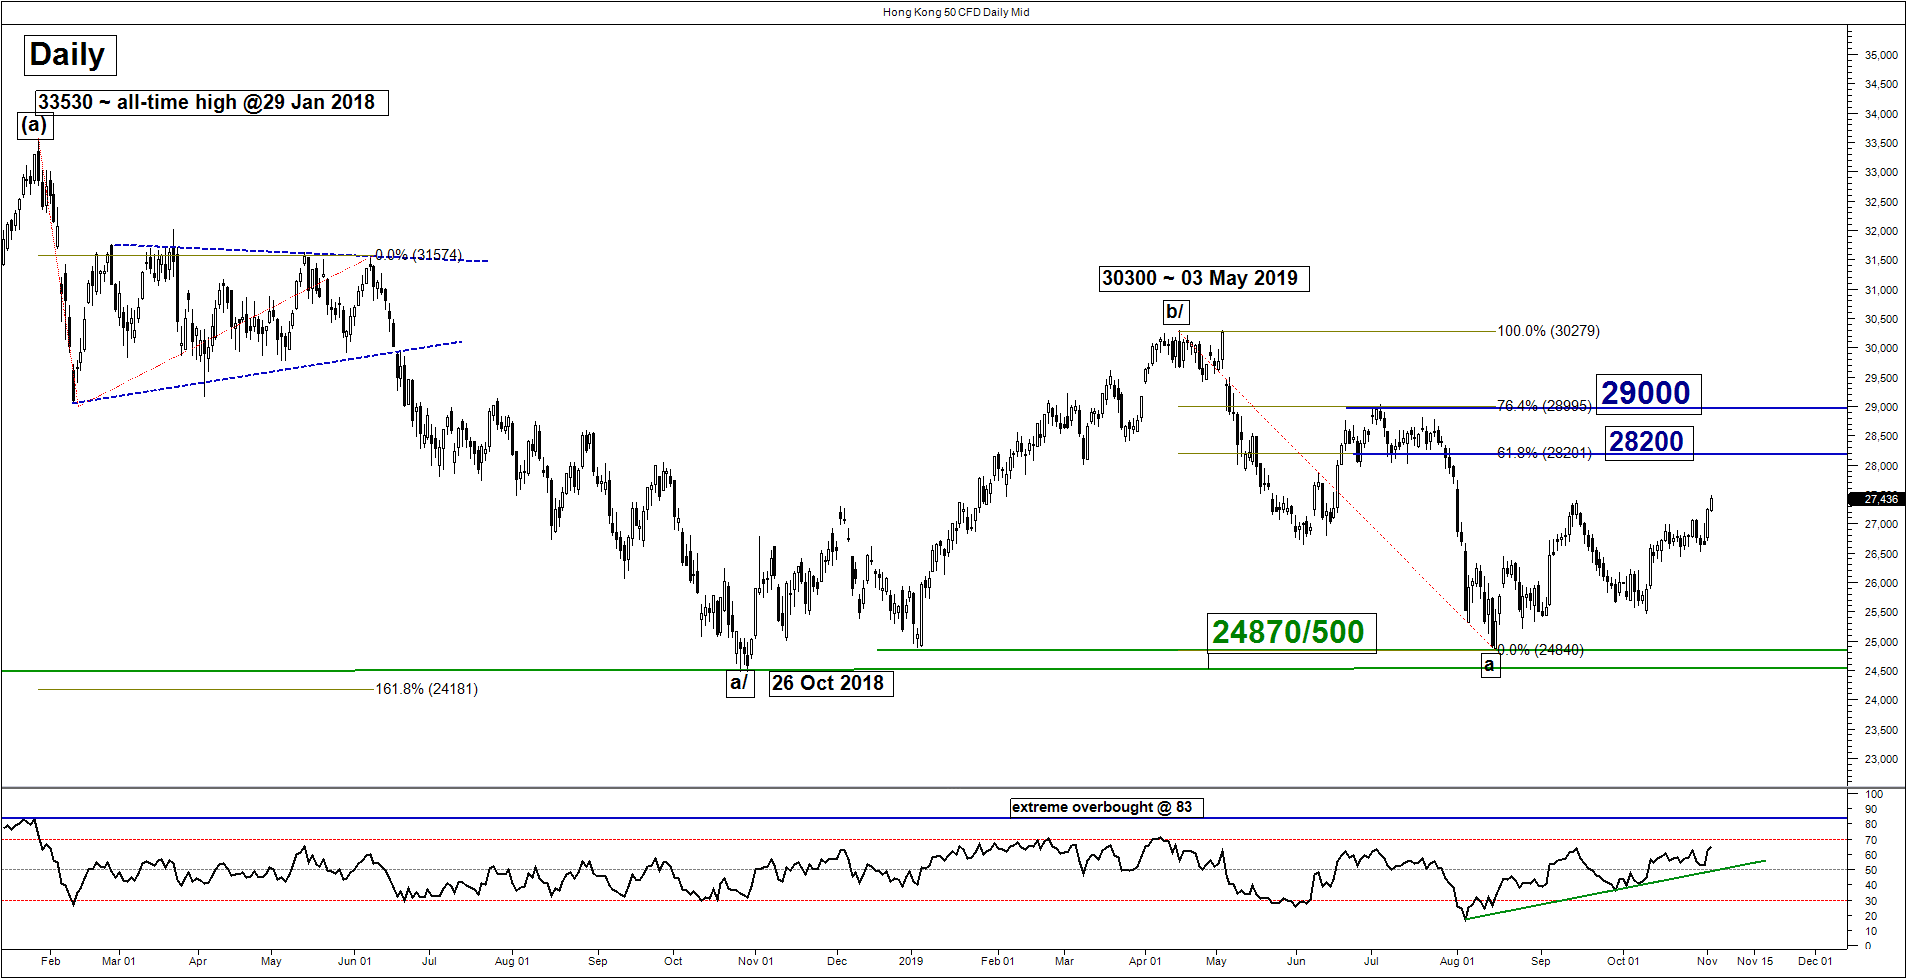
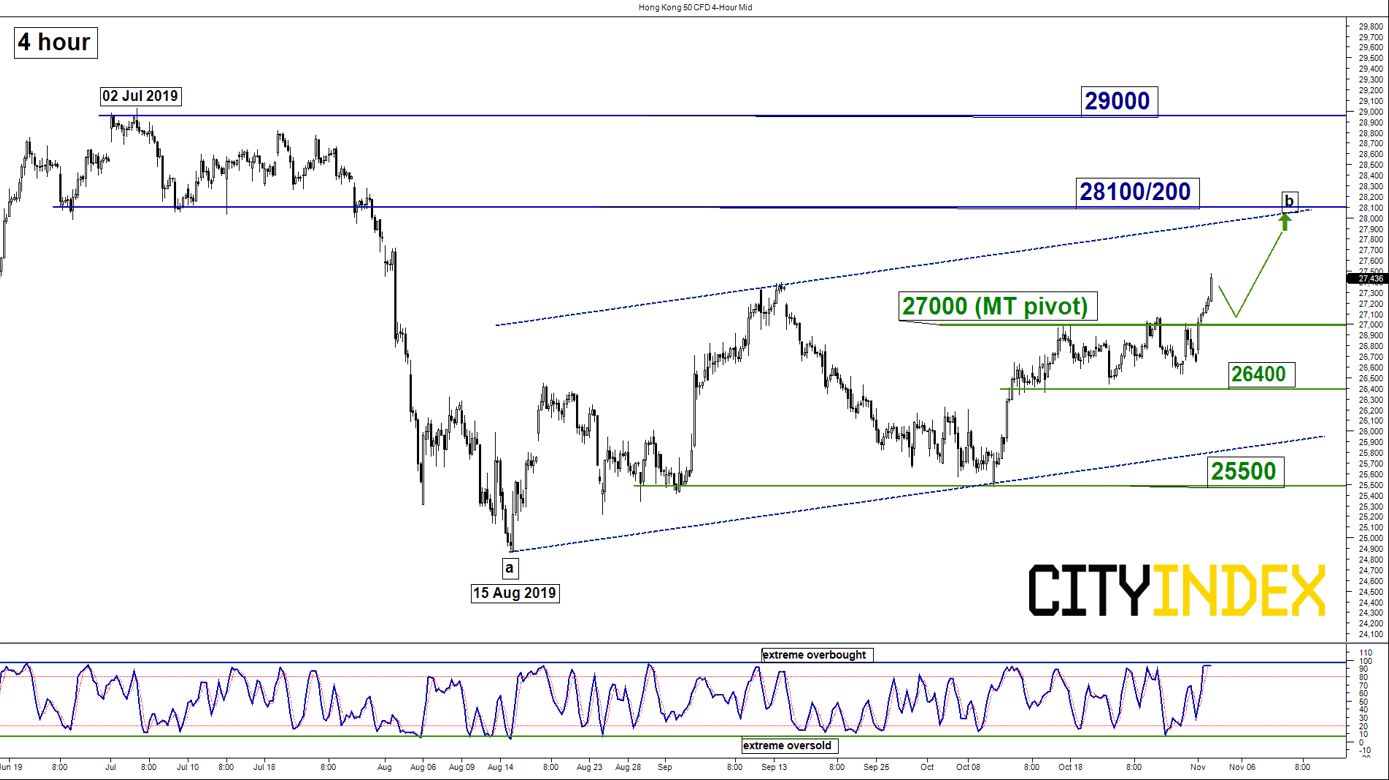
Pivot (key support): 27000
Resistances: 28100/200 & 29000
Next supports: 26400 & 25500
Directional Bias (1 to 3 weeks)
The Hong Kong 50 Index (proxy for Hang Seng Index futures) is now breaking above last week’s 27400 key medium-term resistance and it is likely that the on-going rebound from 15 Aug 2019 low of 24870 remains intact.
Flip to a bullish bias in any dips above 27000 key medium-term pivotal support for a potential extension of the corrective rebound sequence in place since 15 Aug 2019 low to target the 28100/200 resistance with a maximum limit set at 29000.
However, a break with a daily close below 27000 revives the bears for a drop back towards 26400 follow by 25500 within a major “triangle” or sideways range configuration in place since 26 Oct 2018 low.
Key elements
- The daily RSI oscillator has remained in a positive configuration above the 50 level and an ascending support in place since 15 Aug 2019 low.
- The 28100/28200 resistance is defined by the upper boundary of a minor ascending range configuration in place since 15 Aug 2019 low, former swing low areas of 26 Jun/15 Jul 2019 and the 61.8% Fibonacci retracement of the previous decline from 03 May high to 15 Aug 2019 low.
ASX 200 – Potential push down to “Expanding Wedge” range support
click to enlarge charts
Key Levels (1 to 3 weeks)
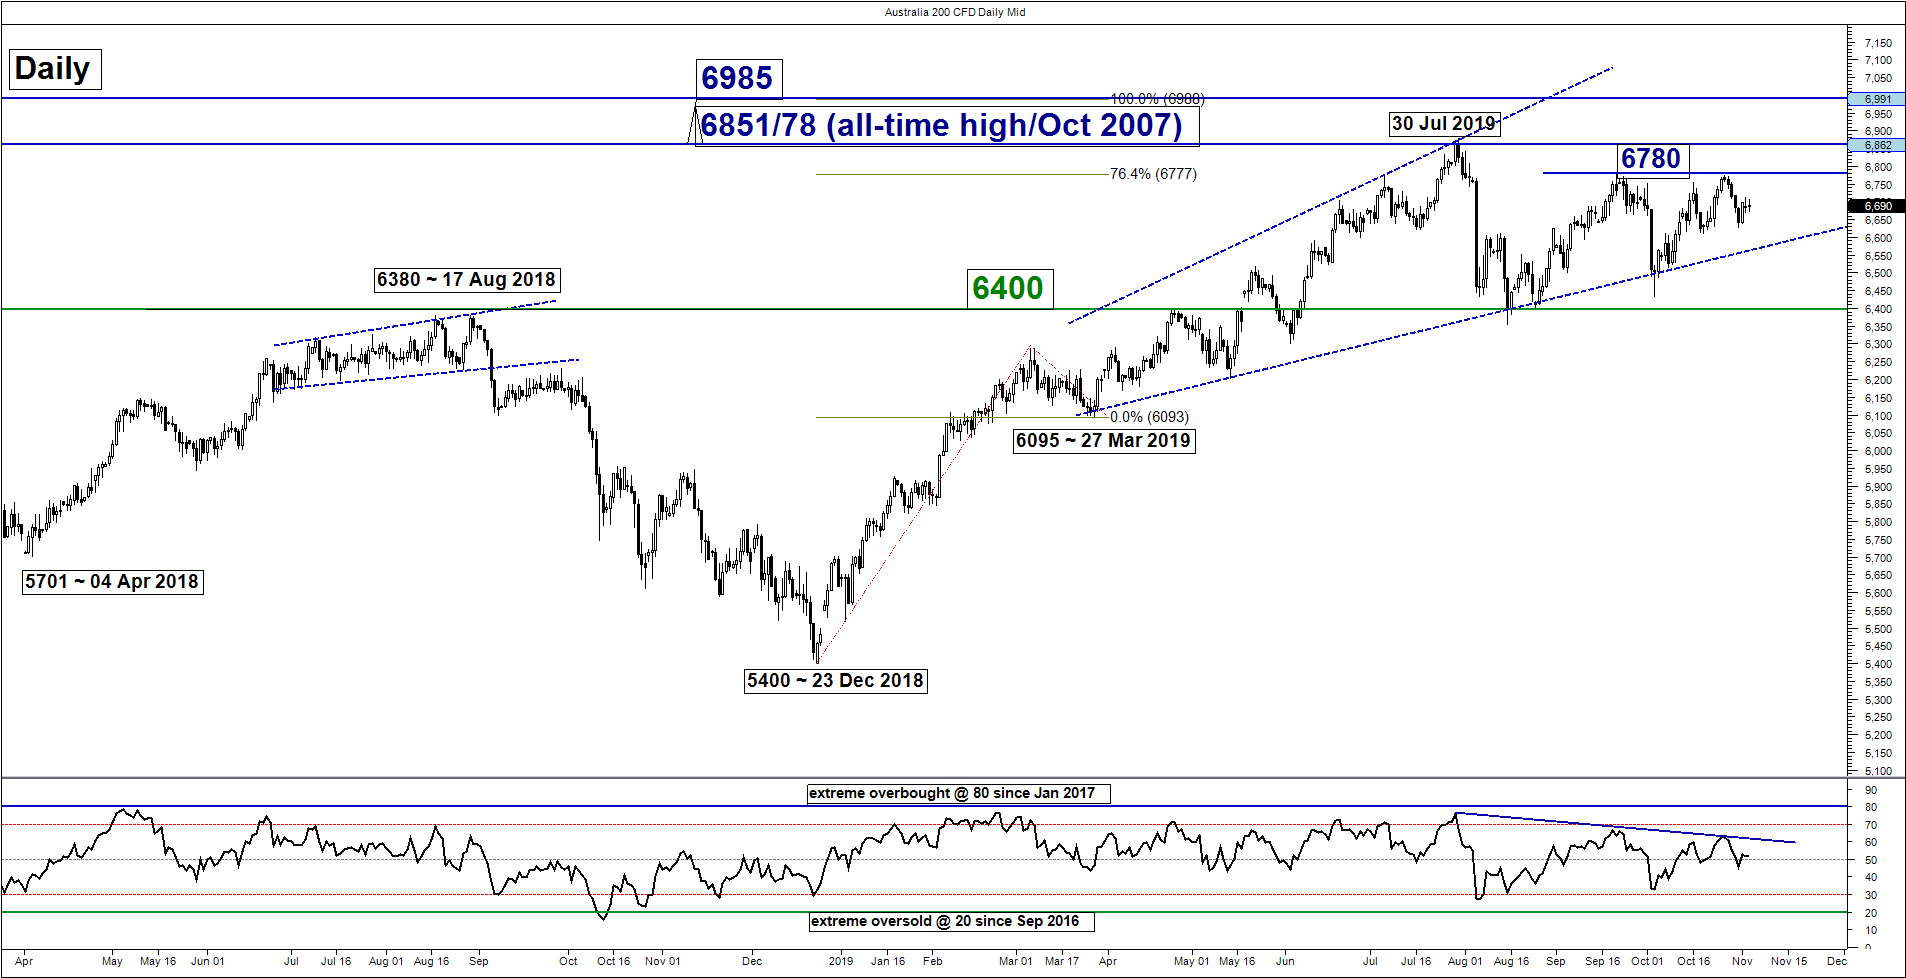
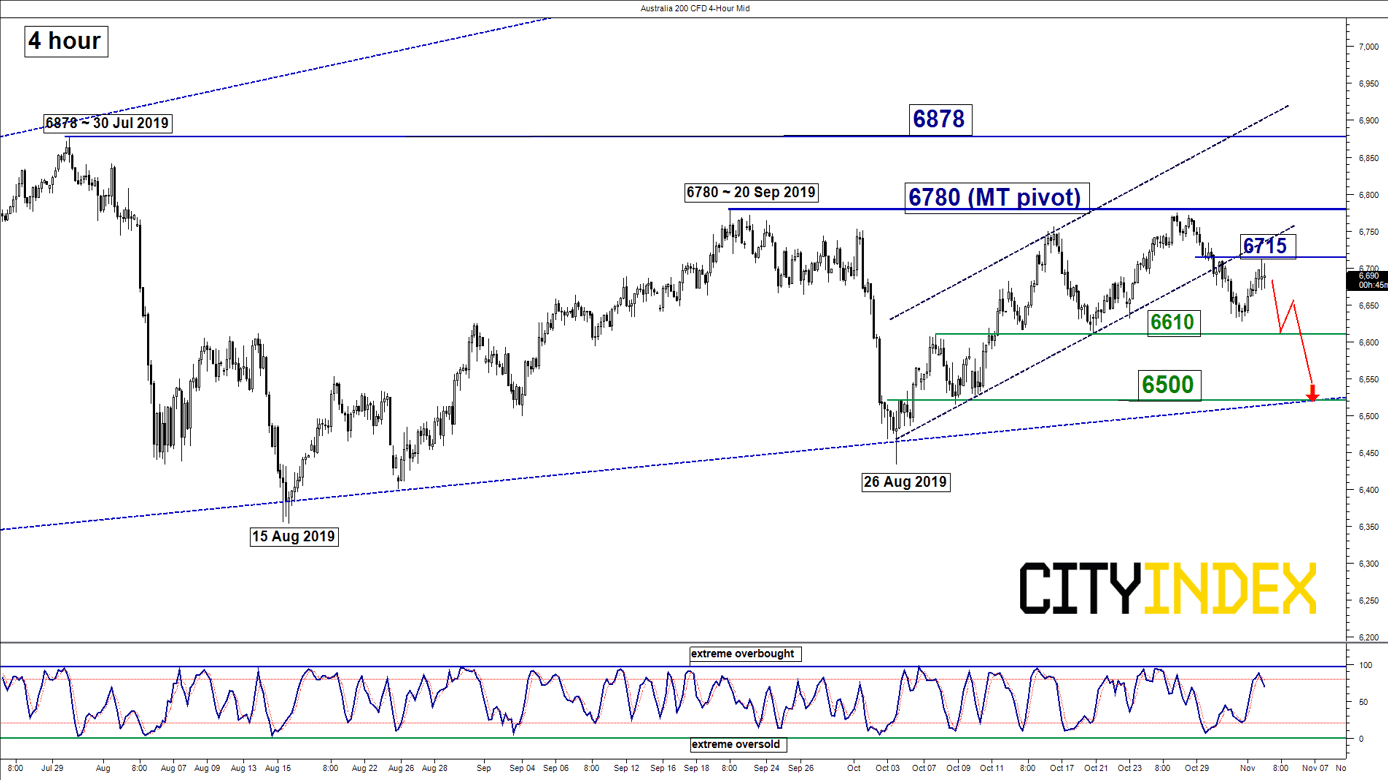
Intermediate resistance: 6715
Pivot (key resistance): 6780
Supports: 6610 & 6500
Next resistance: 6878
Directional Bias (1 to 3 weeks)
Flip to a bearish bias below 6780 key medium-term pivotal resistance for a potential push down towards 6610 before targeting the 6500 “Expanding Wedge” range support in place since 27 Mar 2019 low.
On the other hand, a clearance with a daily close above 6780 invalidates the bearish tone for a squeeze up to retest the 30 Jul 2019 swing high/all-time high area of 6878.
Key elements
- The daily RSI oscillator has continued to be capped by a corresponding descending resistance in place since 30 Jul 2019.
- The price action of the Index has broken below a minor ascending channel support from 26 Aug 2019 low now turns pull-back resistance at around 6715.
DAX – 13200 remains the key resistance to watch
click to enlarge charts
Key Levels (1 to 3 weeks)
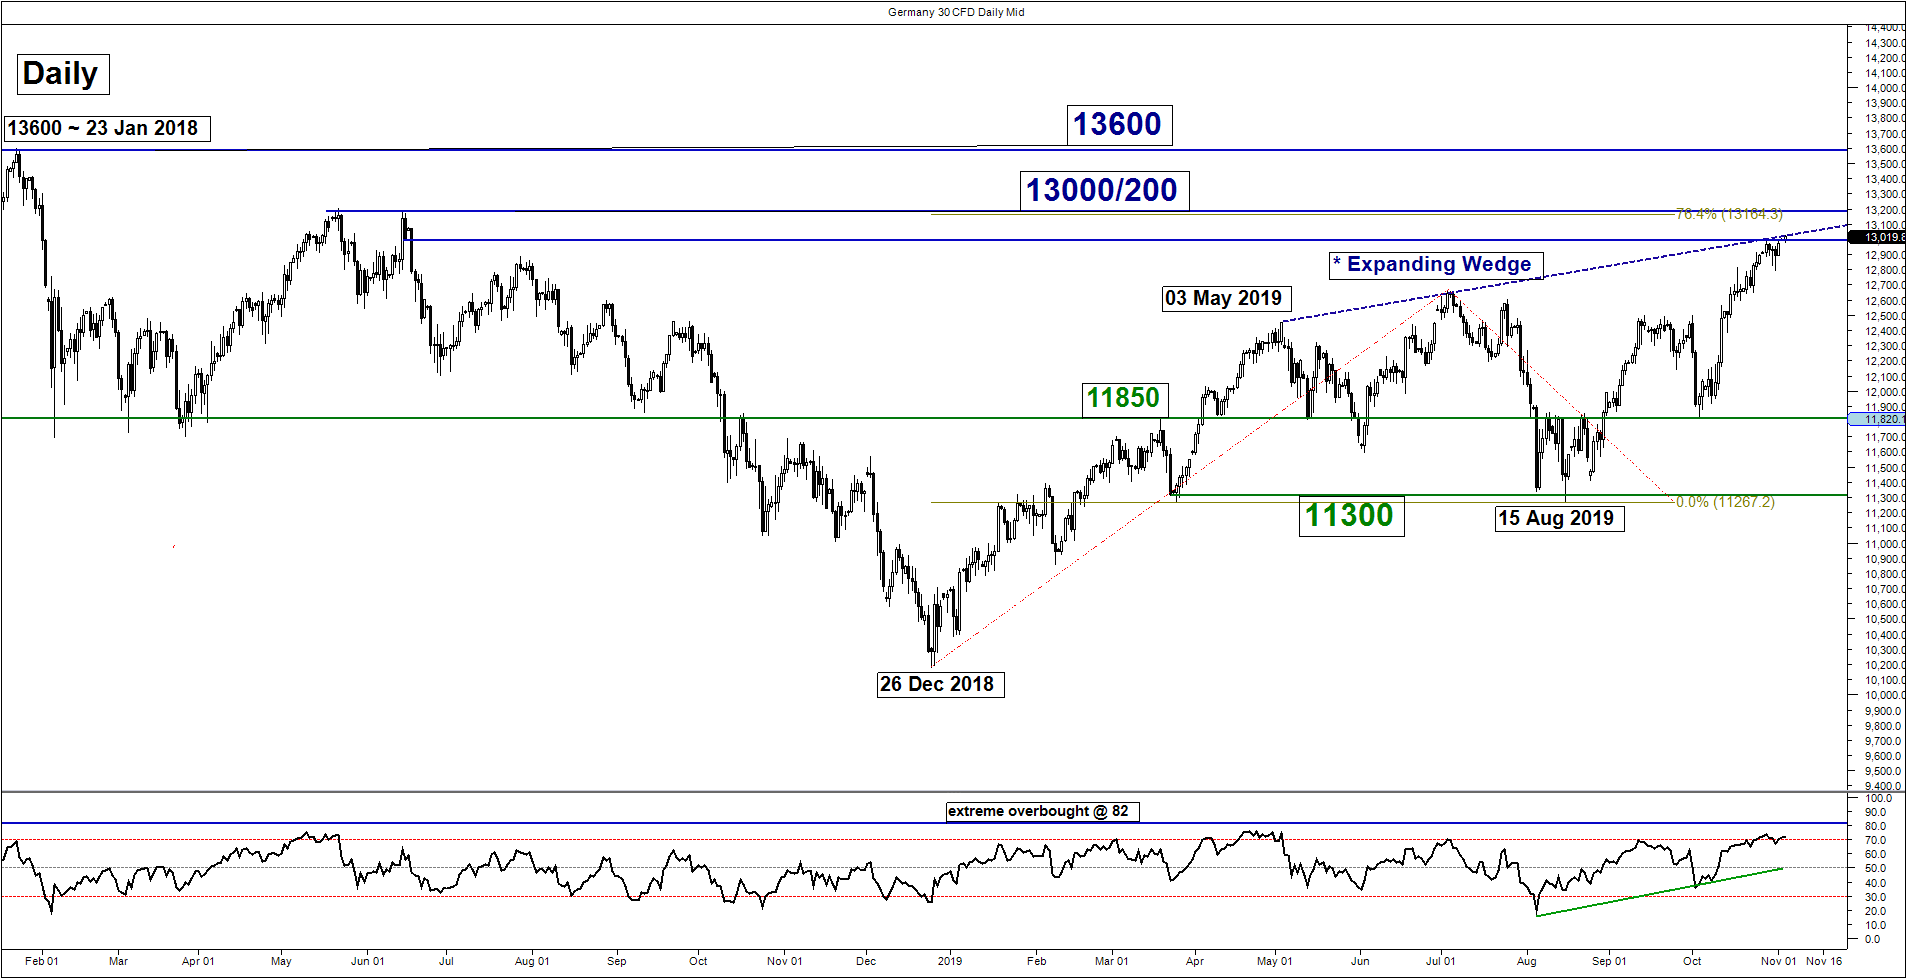
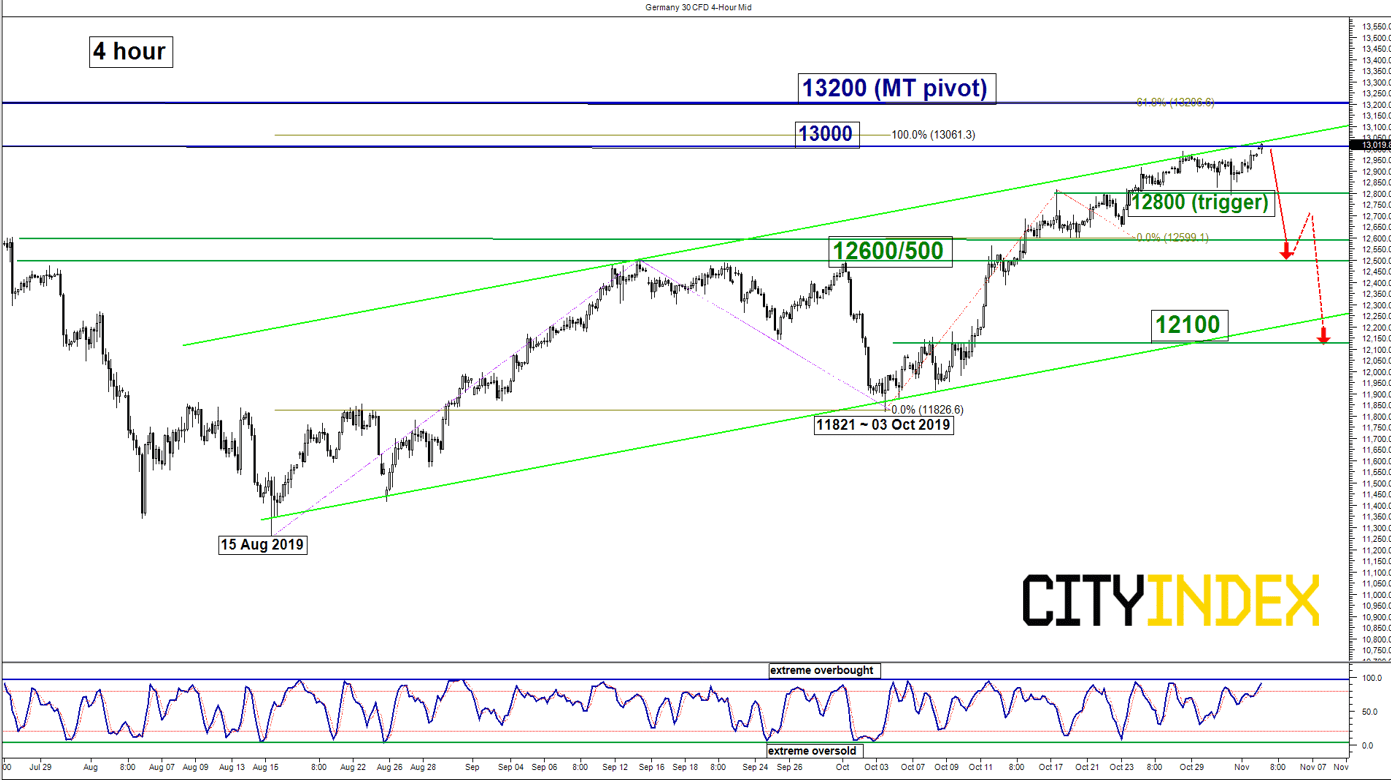
Intermediate resistance: 13000
Pivot (key resistance): 13200
Supports: 12800, 12600/500 & 12100
Next resistance: 13600 (all-time high)
Directional Bias (1 to 3 weeks)
The Germany 30 Index (proxy for the DAX futures) has traded sideways last week and staged a retest on the upper boundary of the minor ascending channel resistance from 15 Aug 2019 low, acting as a resistance at 2100
Key elements have remained the same; maintain bearish bias below the 13200 key medium-term pivotal resistance and added 12800 as the downside trigger level to reinforce a potential corrective decline to retest 12600/500 (the former minor swing high area of 13 Sep/01 Oct 2019 in the first step. A break below 12500 sees a further slide towards 12100 support next (the lower boundary of the minor ascending channel from 15 Aug 2019 low & former minor swing high areas of 08/09 Oct 2019).
However, a clearance with a daily close above 13200 sees an extension of the up move to test the current all-time high level of 13600.
Charts are from City Index Advantage TraderPro & eSignal
Latest market news
Yesterday 10:44 PM
Yesterday 05:00 PM
Yesterday 03:13 PM
Latest Germany 40 articles

February 20, 2024 11:00 AM

January 17, 2024 12:25 PM
January 10, 2024 12:00 PM

November 1, 2023 12:19 PM