


As economic growth indicators guide monetary policies and influence oil demand potential, the current leading indicators include:
- Chinese Manufacturing PMI, which posted a reading of 50.4 today, indicating continued expansion in the industrial sector
- The U.S. ISM Manufacturing PMI expectation to touch the lower limit of the industrial expansion metric at 50 on Wednesday
- Anticipated growth in the U.S ISM Services PMI from 51.4 towards 52 on Friday
- The Fed’s economic outlook, to be unveiled following the rate decision on Wednesday, and provide insight into projected growth levels for the U.S economy, and consequently, oil demand
- U.S Treasury Secretary Janet Yellen’s statement suggesting that U.S. economic growth may have been stronger than indicated by first-quarter output data
From a technical perspective: USOIL and UKOIL proceed with another correction this week touching the 82.22 and 86.81 lows respectively.
UKOIL – 1H Time Frame – Logarithmic Scale

The current daily low on the UKOIL chart touched down at a 100% Fibonacci extension from the 88.61 and 88.20 highs, reaching the 86.81 low. Rebounding from the mentioned low, a bullish engulfing candle across the 1H to 4H has secured bullish sentiment, with potential price levels expected to reach near 88.30 and 88.60, following the breakout above 88. On the downside, a break below today’s low could potentially lead towards critical support levels around 86.50 and 86 in the short run, and 85.20 in the longer run.
USOIL – 1H Time Frame – Logarithmic Scale
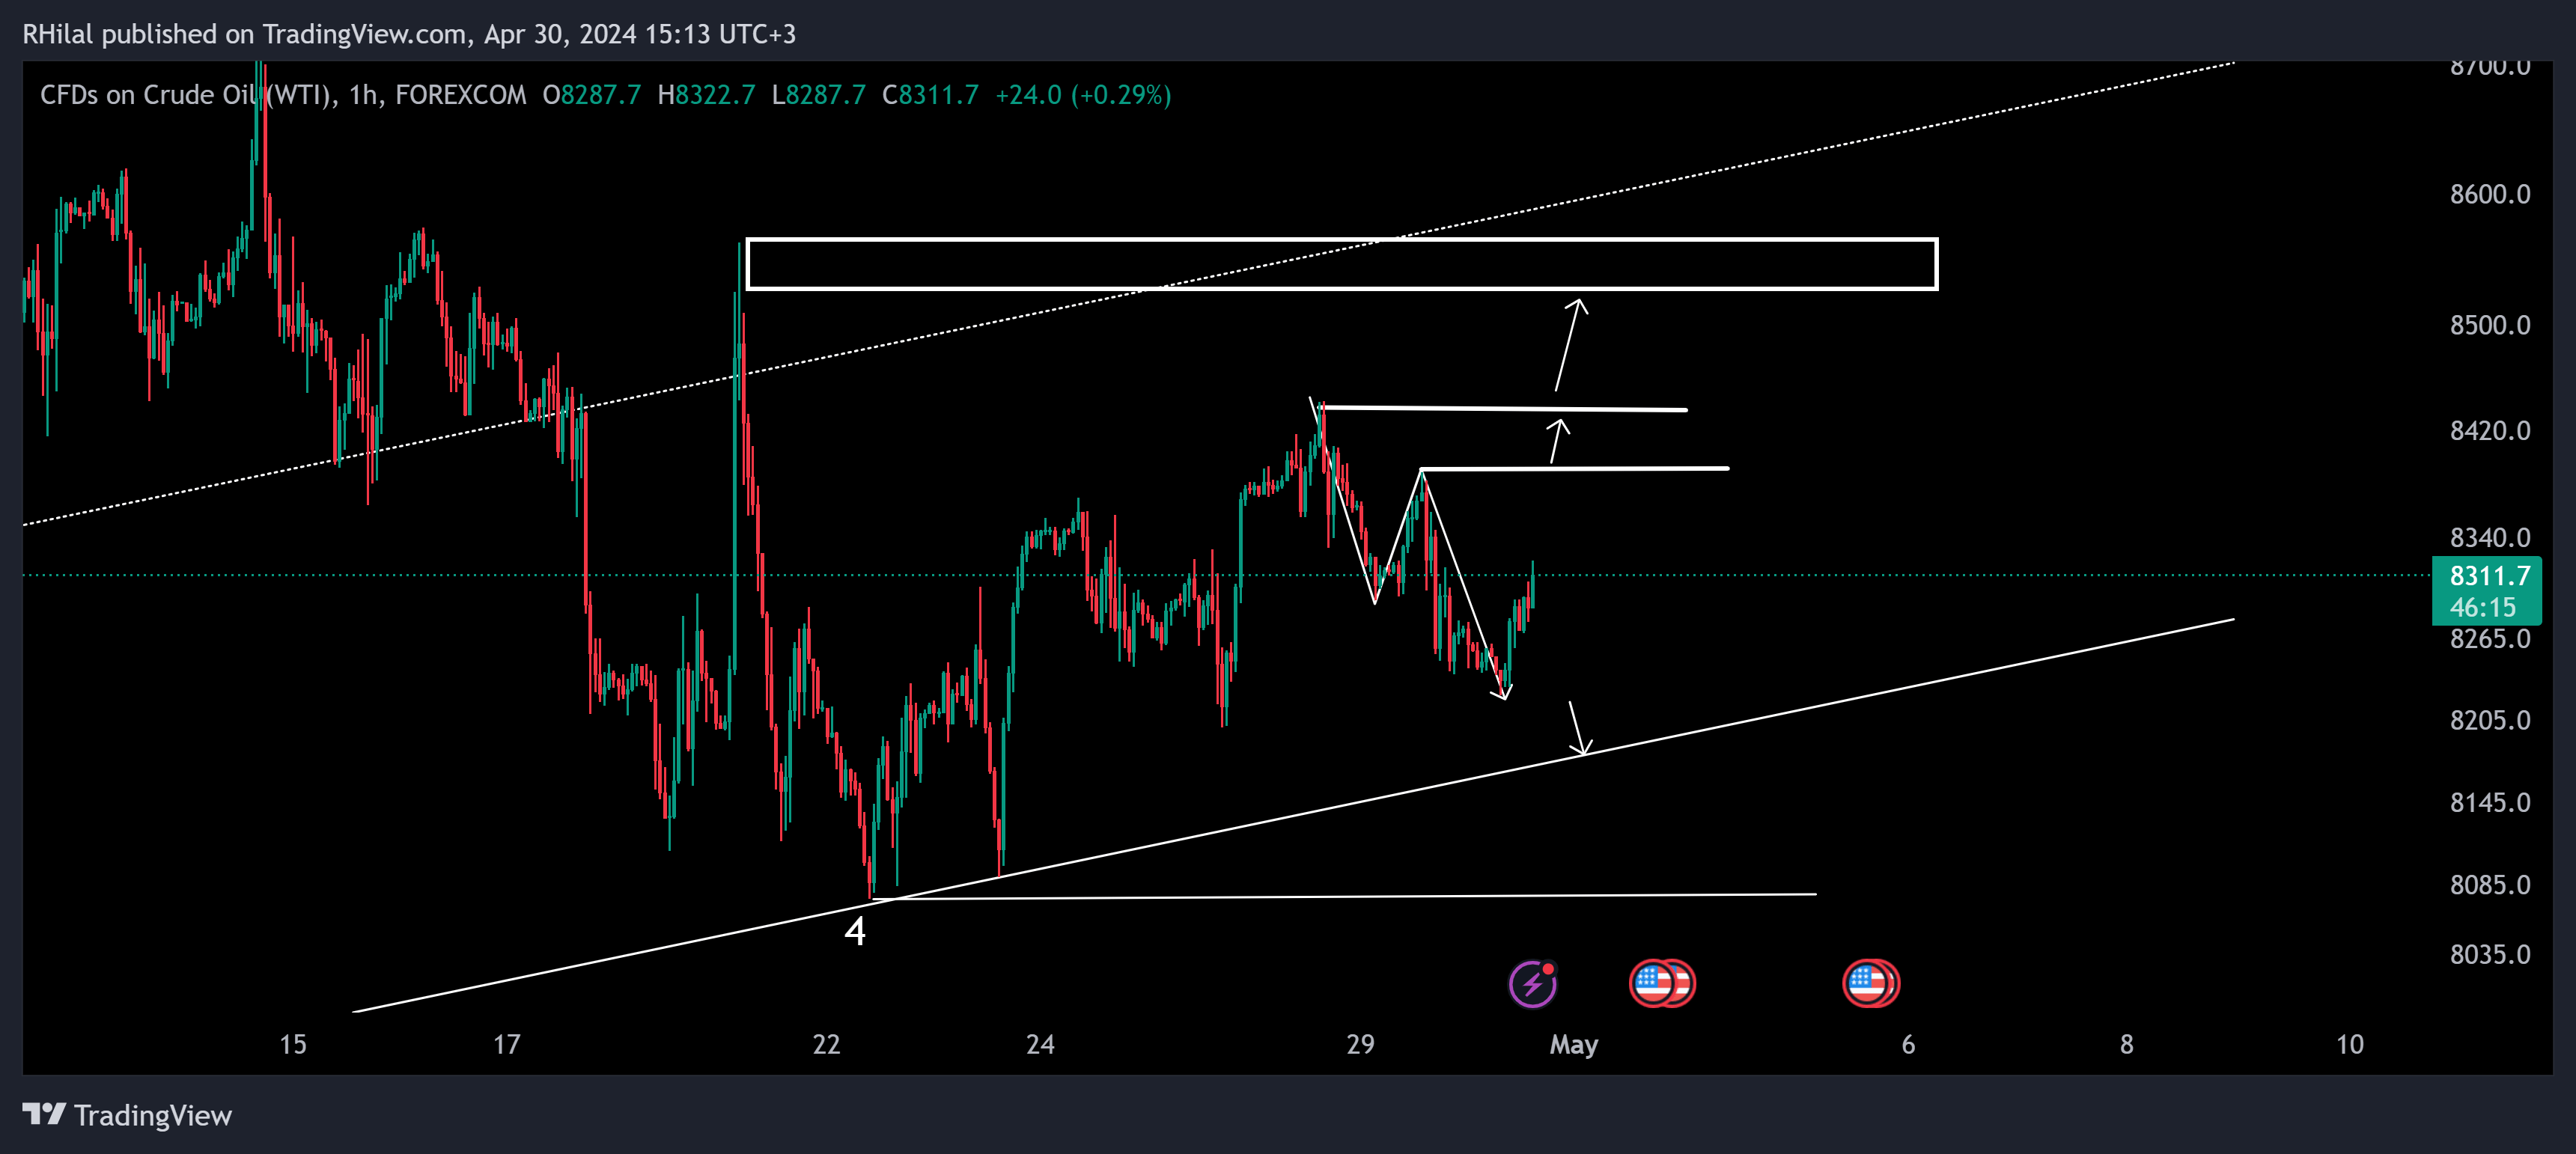
Similar to UKOIL, the daily low on USOIL extended slightly beyond the 100% Fibonacci extension from the highs of 84.42 and 83.88, reversing with a bullish engulfing pattern across the 1H and 4H time frames.
The mid and bottom ends of the year’s up trending channel remain significant resistance and support levels, respectively within the parameters of 85.70 and 80.70. From a 1H time frame perspective, a bullish drive above the 83.80 zone could encounter resistance near the short term high of 84.40, and the longer-term high near 85.70. On the downside, a break below the 82 level can potentially lead to the retest of lows around 81.70 and 80.70.
Expanding economic growth statistics have the potential to revive Crude Oil’s bullish momentum; however, ISM PMI metrics falling below expectations or the 50 expansion criteria could signal otherwise, potentially leading oil prices to retest critical lows along this year’s bull run.
Latest market news
Today 03:00 PM
Today 02:12 PM
Today 01:23 PM
Today 12:15 PM
Latest UK Crude Oil articles

May 7, 2024 05:00 PM
May 3, 2024 12:11 PM

February 21, 2024 03:30 PM
February 11, 2024 06:00 AM