
(Click to enlarge charts)
What happened yesterday/earlier
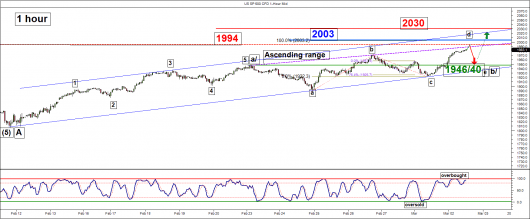
The U.S. SP 500 Index (proxy for the S&P 500 futures) has managed to shape the expected push up from the predefined short-term support at 1920 (also the lower boundary of the bullish ascending channel in place since 11 February 2016 low) hit the our short-term upside target at 1971/84.
Please click on this link for a recap on our previous outlook/strategy.
Key elements
- Yesterday push up in price action has led the Index to come close to a significant resistance at 1994 which is our medium-term upside target as per highlighted in our latest weekly outlook/strategy (click here for a recap on the derivation of this level).
- Based on the Elliot Wave Principal, yesterday’s bullish price move is the d upleg of an “Ascending Range” triangle configuration that consists typically a set of five waves structure labelled as (a,b,c,d,e) that started from the 1947 printed on 23 February 2016. The price action is now at the “Ascending Range” triangle configuration range top which is just right below the significant resistance of 1994 where a potential down leg is likely to occur to complete the wave e of the “Ascending Range” triangle at the range support of 1946/40 before another round of rally kick starts for wave c/.
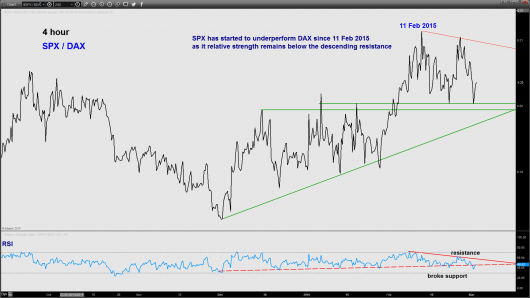
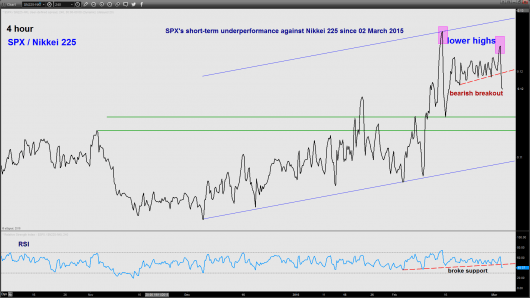
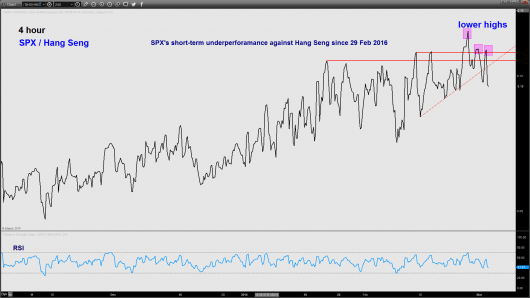
- The reason why we adopt this lesser bullish wave count (rather than the impulsive 1,2,3,4,5 sequence) on the SP 500 Index because of its short-term’s underperformance since last week against the majors indices (DAX, Nikkei 225 & Hang Seng). Refer to the attached relative strength charts.
- There will be a potential excess of 2003 above 1994 which is defined by the 1.00 Fibonacci projection of the rally from 24 February 2016 low at 1890 to 26 February 2016 high of 1971 projected from yesterday low of 1922.
- The hourly (short-term) Stochastic oscillator and daily RSI oscillator are showing limited upside potential at this juncture.
Key levels (1 to 3 days)
Intermediate resistance: 1994
Pivot (key resistance): 2003
Support: 1946/40
Next resistance: 2030
Conclusion
The Index is now coming close to the significant resistance at 1994 with short-term technical elements getting “exhausted” on the upside. The Index may see a push up to test the 1994 level with a maximum limit set at the 2003 short-term pivotal resistance for a potential pull-back to target the range support at 1946/40.
On the other hand, a clearance above the 2003 pivotal resistance is likely to open up scope for a further rally towards the next resistance at 2030.
Disclaimer
This report is intended for general circulation only. It should not be construed as a recommendation, or an offer (or solicitation of an offer) to buy or sell any financial products. The information provided does not take into account your specific investment objectives, financial situation or particular needs. Before you act on any recommendation that may be contained in this email, independent advice ought to be sought from a financial adviser regarding the suitability of the investment product, taking into account your specific investment objectives, financial situation or particular needs. All queries regarding the contents of this material are to be directed to City Index, a trading name of GAIN Capital Singapore Pte Ltd.
Trading CFDs and FX on margin carries a high level of risk that may not be suitable for some investors. Consider your investment objectives, level of experience, financial resources, risk appetite and other relevant circumstances carefully. The possibility exists that you could lose some or all of your investments, including your initial deposits. If in doubt, please seek independent expert advice. Visit cityindex.com.sg for the complete Risk Disclosure Statement.


