 (Click to enlarge charts)
What happened yesterday/earlier
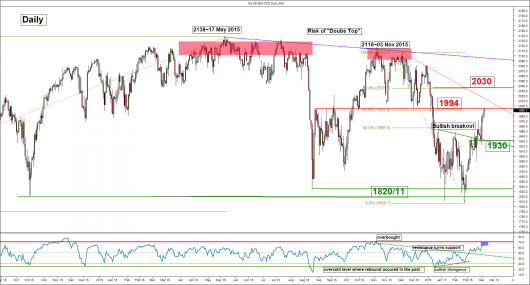
The U.S. SP 500 Index (proxy for the S&P 500 futures) has again pushed up higher as expected in the mid-U.S. session and hit the significant resistance of 1994 which is also our medium-term upside target for this week (click here to recap our weekly outlook/strategy).
To recap our previous short-term daily outlook/strategy, click here.
Key elements
- Latest price action has pushed and hit the 1994 significant resistance as defined by a Fibonacci cluster and the former swing low of 14 December 2015 that was tested thrice in 28 August, 17 September and 14 October 2015.
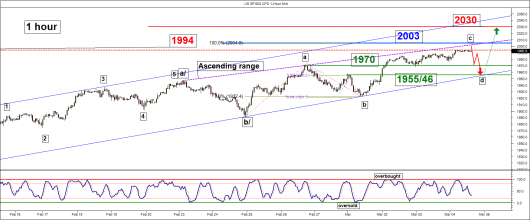
- The potential excess above 1994 stands at 2003 which is defined by the 1.00 Fibonacci projection of the rally from 24 February 2016 low at 1890 to 26 February 2016 high of 1971 projected from 01 March 2016 low of 1922 and the upper boundary of an “ascending range” triangle configuration in place since 23 February 2016 high of 1947.
- Based on the Elliot Wave Principle, the Index is likely to have almost reached the tail end of the wave c of the “ascending range” triangle configuration at 2003 that started from 01 March 2016 low of 1992. Thereafter, the wave d downleg is likely to unfold before a possible last upleg wave e materialises to complete the “ascending range” triangle as well as the wave c/of an intermediate degree to conclude the potential end of the second phase of the countertrend rally that started from 24 February 2016 low of 1890. An “ascending range” triangle configuration consists typically a set of five waves sequence labelled as (a,b,c,d,e) that started from 23 February 2016 high of 1947.
- The daily RSI oscillator has almost reached its extreme overbought level which suggests limited upside potential in price action at this juncture.
- The lower boundary (support) of the “ascending range” triangle configuration now rests at 1955/46.
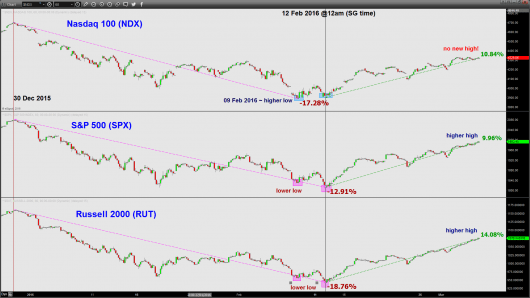
- In addition, the internal structure of the U.S. stock market has turned weak in the short-term. The market leader, Nasdaq 100 which is the only index that has made a higher low (bottomed out first) on 09 February 2016 before the start of the of this countertrend rally on 12 February 2016 @12am (Singapore time) seen in S&P 500 and the Russell 2000 (an index that comprises small caps stocks). However, yesterday the Nasdaq 100 has failed to make a new daily high as compared with the laggard, Russell 2000 and the S&P 500 (refer to the last chart).
Key levels (1 to 3 days)
Pivot (key resistance): 1994/2003
Supports: 1970 & 1955/46
Next resistance: 2030
Conclusion
The U.S. SP 500 Index has reached our medium-term upside target at 1994 for this week. Technical elements have turned negative on the short-term. Therefore as long as the 2003 short-term pivotal resistance is not surpassed, the Index is likely to see a potential pull-back towards 1970 before the range support at 1955/46.
However, a clearance above 2003 may turn the table by to the bulls for a further rally to target the next resistance at 2030
Disclaimer
This report is intended for general circulation only. It should not be construed as a recommendation, or an offer (or solicitation of an offer) to buy or sell any financial products. The information provided does not take into account your specific investment objectives, financial situation or particular needs. Before you act on any recommendation that may be contained in this email, independent advice ought to be sought from a financial adviser regarding the suitability of the investment product, taking into account your specific investment objectives, financial situation or particular needs. All queries regarding the contents of this material are to be directed to City Index, a trading name of GAIN Capital Singapore Pte Ltd.
Trading CFDs and FX on margin carries a high level of risk that may not be suitable for some investors. Consider your investment objectives, level of experience, financial resources, risk appetite and other relevant circumstances carefully. The possibility exists that you could lose some or all of your investments, including your initial deposits. If in doubt, please seek independent expert advice. Visit cityindex.com.sg for the complete Risk Disclosure Statement.


