(Click to enlarge charts)
What happened earlier/yesterday
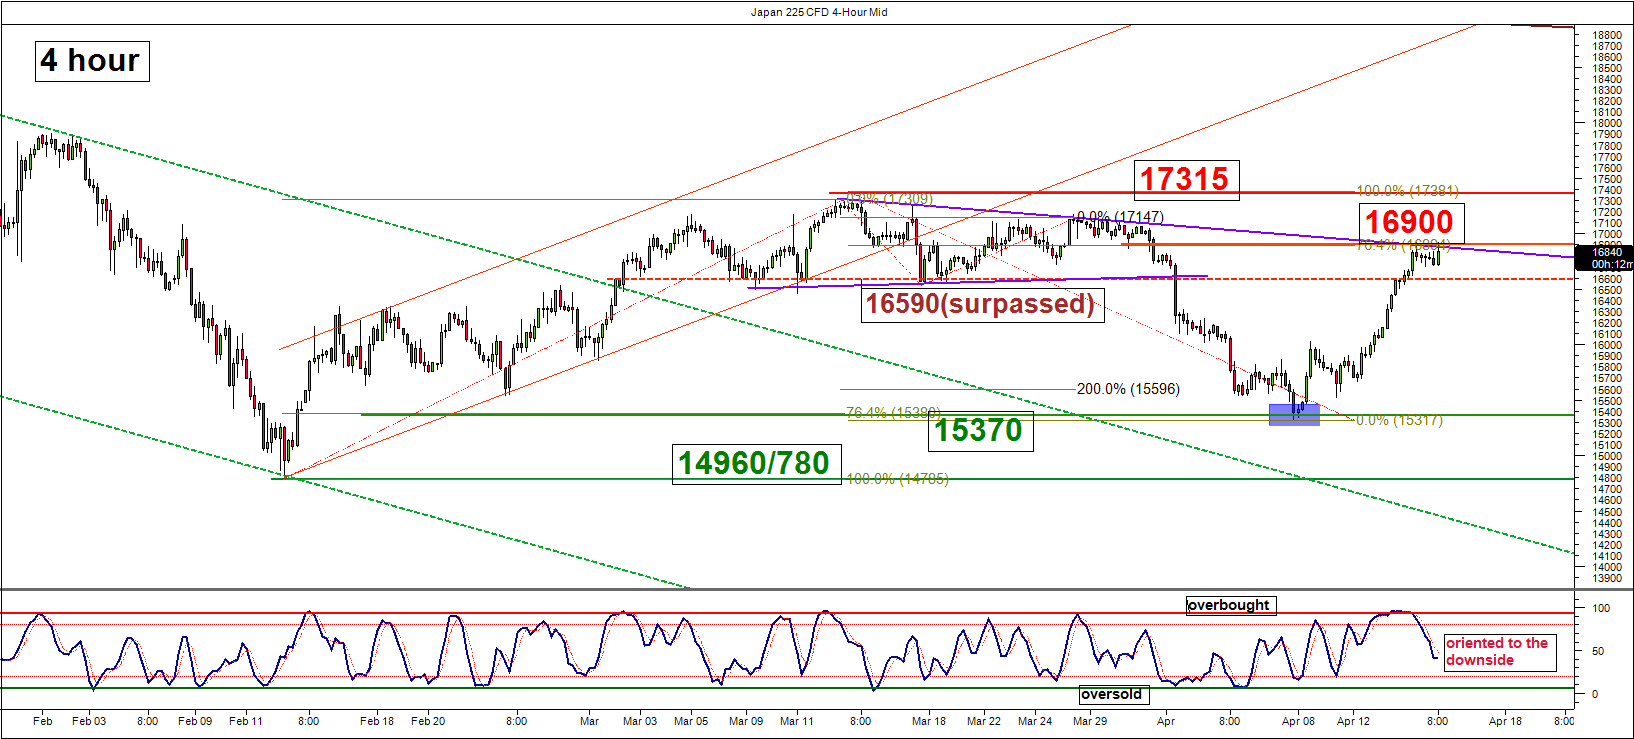
The Japan 225 Index (proxy for the Nikkei 225 futures) has attempted to stage an upside move earlier in this morning session, 15 April 2016 but failed to break above our predefined short-term pivotal resistance at 16900 as per highlighted in our prior daily short-term strategy/outlook (click here for a recap).
Key elements
- The 16900 resistance is defined by a a trendline resistance that has linked up the lower highs since 14 March 2016 high and the 76.4% Fibonacci retracement of the decline from 14 March 2016 high to 07 April 2016 low of 15329 (see 4 hour chart).
- Based on the Elliot Wave Principal in conjunction with fractal analysis, current price action of the Index suggests that it may be evolving into a “Symmetrical Triangle” range configuration from the 11 February 2016 low.
- Price action of the Index has broken below the steeper short-term ascending channel’s support (in green) from the 12 April 2016 low @6a.m. Interestingly, this morning push up in price action has tested and retreated from the pull-back resistance of this former ascending’s support which is also at 16900 (same level as the longer term trendline resistance as per mentioned in the first pointer).
- The 4 hour Stochastic oscillator is oriented to the downside and still has room for further decline before reaching its extreme oversold level coupled with the bearish divergence signal seen in the 1 hour Stochastic oscillator. These observation suggests that short-term downside momentum has surfaced which reinforces the potential short-term pull-back view in price action.
- The near-term supports remains at 16590 follow by 16200/16030 (former swing high area of 04 April 2016 + ascending channel’s support from 08 April 2016 low).
Key levels (1 to 3 days)
Pivot (key resistance): 16900
Supports: 16590 & 16200/16030
Next resistance: 17315
Conclusion
As long as the 16900 short-term pivotal resistance is not surpassed and a break below the first short-term support at 16590 is likely to trigger the expected deeper pull-back to target the 16200/16030 support zone.
However, a clearance above the 16900 short-term pivotal resistance may invalidate the pull-back scenario for a potential further direct rise towards the next resistance at 17315 (the 15 March 2016 swing high).
Disclaimer
This report is intended for general circulation only. It should not be construed as a recommendation, or an offer (or solicitation of an offer) to buy or sell any financial products. The information provided does not take into account your specific investment objectives, financial situation or particular needs. Before you act on any recommendation that may be contained in this email, independent advice ought to be sought from a financial adviser regarding the suitability of the investment product, taking into account your specific investment objectives, financial situation or particular needs. All queries regarding the contents of this material are to be directed to City Index, a trading name of GAIN Capital Singapore Pte Ltd.
Trading CFDs and FX on margin carries a high level of risk that may not be suitable for some investors. Consider your investment objectives, level of experience, financial resources, risk appetite and other relevant circumstances carefully. The possibility exists that you could lose some or all of your investments, including your initial deposits. If in doubt, please seek independent expert advice. Visit cityindex.com.sg for the complete Risk Disclosure Statement.