


- Nasdaq 100 outlook: focus turns to key technology earnings
- Stronger US PMI data has boosted ‘higher for longer’ narrative
- Nasdaq 100 technical levels to watch
The Nasdaq 100 gave up earlier gains and was trading flat at the time of writing, ahead of major earnings. Stronger-than-expected PMI data earlier from the US, where both the services and manufacturing sectors showed moderate expansion with 50+ readings, boosted the “higher for longer” narrative. The market is now even more convinced that the Fed will keep interest rates elevated for an extended period, and this is holding back stocks. But today’s focus will be on company earnings, with tech giants Microsoft and Alphabet to report their results today, followed by Meta tomorrow and Amazon on Thursday.
Earlier, European markets rose following Monday’s recovery on Wall Street and as bond markets stabilized, and the return of the selling in precious metals and oil markets. Echoing the “risk-on” sentiment, Bitcoin had extended its weekly advance to more than 15%, reaching above $35K for first time since May 2022 with expectations being rife about an imminent approval of a bitcoin ETF by the SEC. As well as the release of earnings from Microsoft and Alphabet today ahead of more tech earnings, investors are looking forward to key economic pointers and the ECB’s rate decision later in the week.
Nasdaq 100 outlook: technical levels to watch
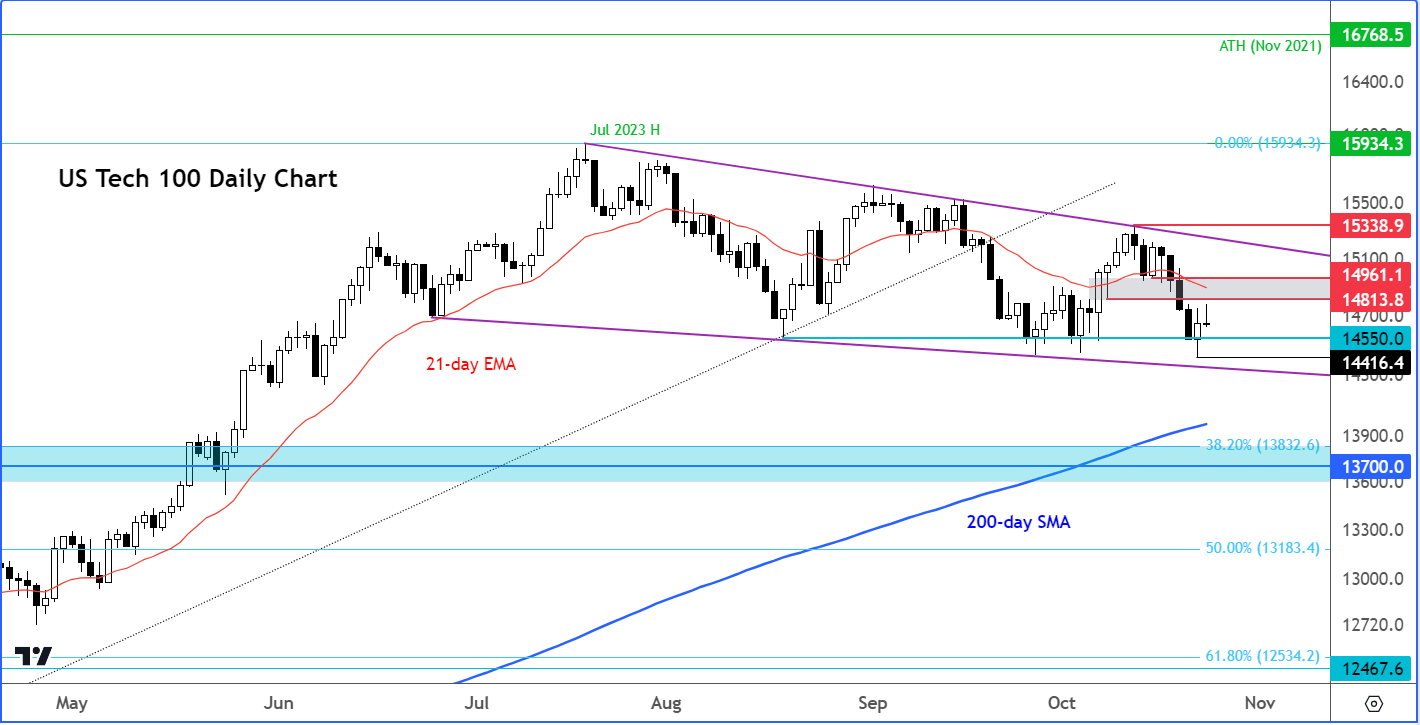
Source: TradingView.com
Ahead of these earnings, the Nasdaq 100 is holding inside a large consolidation pattern, which means I wouldn’t read too much into today’s price action. The rising 200-day average is still objectively telling us that the long-term bullish trend is intact, but almost everything else is telling us otherwise. The 21-day for example is now above price action, objectively signalling that it is the bears who are in control of short-term action. Key resistance is seen in the range between 14810 to 14960ish. Let’s see whether the index will rise to test that level, or continue heading lower after Monday’s rebound petered out.
Conservative traders may wish to wait for the index to form a decisive signal. The bears would love to see a daily close below that 14550 level which has held firm on a closing basis after several bearish attempts to break it. If that happens then the probability of a bigger correction towards the 200-day or even lower would increase in my view.
On the upside, a break above that 14810 to 14960 range is still needed to convince me that the market has potentially formed a low. Even so, a break above the resistance trend of the falling wedge pattern is needed for confirmation. In other words, the bulls have a lot of wood to chop to turn things back in their favour.
-- Written by Fawad Razaqzada, Market Analyst
Follow Fawad on Twitter @Trader_F_R
How to trade with City Index
You can trade with City Index by following these four easy steps:
-
Open an account, or log in if you’re already a customer
• Open an account in the UK
• Open an account in Australia
• Open an account in Singapore
- Search for the company you want to trade in our award-winning platform
- Choose your position and size, and your stop and limit levels
- Place the trade
Latest market news
Today 05:56 AM
Yesterday 11:57 PM
Yesterday 08:00 PM
Yesterday 02:00 PM
Latest Indices articles

April 25, 2024 03:09 PM

April 25, 2024 03:00 PM
April 24, 2024 03:30 PM

April 18, 2024 04:46 PM