
(Click to enlarge charts)
What happened yesterday
The Hong Kong 40 Index (proxy for the Hang Seng Index) has broken below the 22710/22620 short-term pivotal support and shaped a direct decline to hit our alternate target at 22250/22170.
Please click on this link for a recap on our previous daily outlook.
Key elements
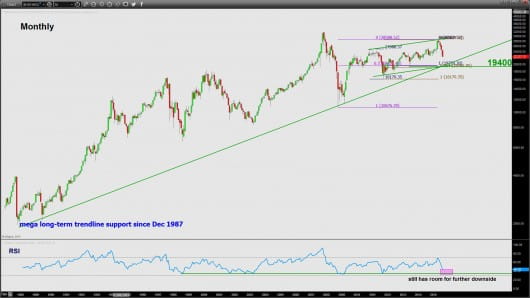
- This week price action has invalidated our bullish outlook for Q3 2015 through the violation of the 23450 former support. From the 26 April 2015 high of 28600, the Index is in the midst of a multi-month correction phase (another potential 10% decline from current level) with the next significant long-term support at 19400 (see monthly chart).
- The 19400 long-term support is defined by the mega long-term ascending trendline in place since December 1987 and a Fibonacci cluster (see monthly chart).
- In terms of Elliot Wave, the Index is in a (a),(b),(c) “Flat” correction configuration of a larger degree wave B that has started from the high of 07 November 2010. From the 26 April 2015 high of 28600, current price movement is in the midst of undergoing the bearish (c) leg of the “Flat” correction that will consists a minimum of five waves from a lesser degree (see weekly chart).
- The longer-term RSI oscillator still has room for further downside before reaching its support/oversold level. This observation supports the aforementioned bearish Elliot Wave count (see monthly chart).
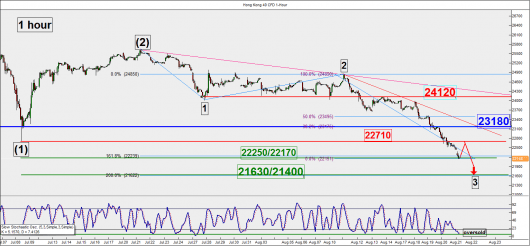
- On a shorter-term, the Index is still capped by a trendline resistance joining the highs since 11 August 2015 now at 23180 (see 1 hour chart).
- The 23180 short-term resistance also confluences with the 38.2% Fibonacci retracement of the most recent down move from 11 August 2015 high @9am to the current 21 August 2015 low of 22139, a potential extended wave 3 (see 1 hour chart).
- The next support to watch will be at 21630/21400 which is defined by the 2.00 Fibonacci projection from 21 July 2015 high @1pm to 11 August 2015 high @9am and the horizontal support linking the lows of the weekly candlesticks from 25 August 2013 to 16 March 2014 (see weekly & 1 hour charts).
- The hourly Stochastic oscillator is now back at the extreme oversold level which highlights the risk of short-term rebound in price action of the Index (see 1 hour chart).
Key levels (1 to 3 days)
Intermediate resistance: 22710
Pivot (key resistance): 23180
Support: 21630/21400
Next resistance: 24120
Conclusion
On a shorter-term, the Index may see a push up towards the intermediate resistance at 22710 with a maximum limit set at the 22710 daily pivotal resistance within a multi-week bearish trend. Thereafter, the Index is likely to resume its downleg to target the next support at 21630/21400.
On the contrary, a break above 23180 pivotal resistance is likely to negate the bearish tone to see a squeeze up towards the next resistance at 24120.
Source: Charts are from eSignal & City Index Advantage Trader
Disclaimer
This report is intended for general circulation only. It should not be construed as a recommendation, or an offer (or solicitation of an offer) to buy or sell any financial products. The information provided does not take into account your specific investment objectives, financial situation or particular needs. Before you act on any recommendation that may be contained in this email, independent advice ought to be sought from a financial adviser regarding the suitability of the investment product, taking into account your specific investment objectives, financial situation or particular needs. All queries regarding the contents of this material are to be directed to City Index, a trading name of GAIN Capital Singapore Pte Ltd.
Trading CFDs and FX on margin carries a high level of risk that may not be suitable for some investors. Consider your investment objectives, level of experience, financial resources, risk appetite and other relevant circumstances carefully. The possibility exists that you could lose some or all of your investments, including your initial deposits. If in doubt, please seek independent expert advice. Visit cityindex.com.sg for the complete Risk Disclosure Statement.


