
 (Click to enlarge charts)
What happened last week
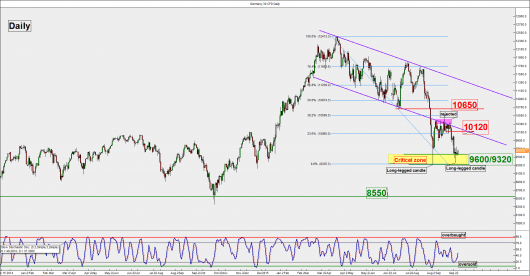
The German 30 Index (proxy for the DAX) has reacted below the 10080/10120 intermediate resistance and staged the expected decline towards 9600/9320 critical support zone.
Please click on this link for a review on our previous weekly outlook.
Key elements
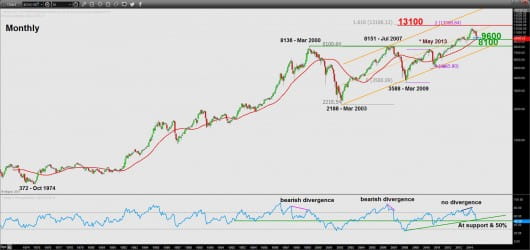
- Last week’s plunge seen in price action of the Index has tested and managed to hold at the critical support zone of 9600/9320.This significant support zone is defined by the 34-month Moving Average (in red), ascending trendline (in orange) joining the lows since 11 September 2011 and the 38.2% Fibonacci retracement of the multi-year uptrend from 11 September 2011 low to 05 April 2015 high (see monthly & weekly charts).
- The decline seen on last Thursday, 24 September 2015 has managed to hold above the lower limit of the significant critical support zone at 9320. In addition, it has formed another similar daily long-legged candlestick as seen on the “Black Monday”, 24 August 2015 low. This is a positive observation because from a behaviour/sentiment perspective it indicates that the bears are hesitant to push the Index lower.
- The daily (medium-term) Stochastic oscillator has exited from its oversold region and still has room for further potential upside before reaching its extreme overbought level. This observation suggests that the medium-term upside momentum remains intact.
- The pull-back resistance of the medium-term descending channel bearish breakout (in purple) is now at 10120 which also confluences with a short-term trendline resistance (in pink) joining the highs since 09 September 2015 at 10080 and a Fibonacci retracement cluster (23.6% of the down move from 12 April 2015 high to 24 August 2015 low + 61.8% of the down move from 09 September 2015 high to 24 September 2015 low) (see daily & 4 hour charts).
- The next significant resistance is at 10650 which is defined by the former swing low of 07 July 2015 (see daily chart).
- Based on the Elliot Wave Principal, the Index has completed (a),(b),(c) “Irregular Flat” correction configuration that has started from 28 August 2015 high @8am. From the 09 September 2015 high of 10523, the Index has traced out a set of 5 waves (lesser degree) of the final bearish (c) leg of the “Flat” correction (see 4 hour charts).
Key levels (1 to weeks)
Pivot (key support): 9320
Resistance: 10080/10120 & 10650
Next support: 8550
Conclusion
Based on the aforementioned technical elements, the Index is likely to have completed its corrective movement on last Thursday, 24 September 2015 (bottomed out) and a potential recovery is in place above its 9600/9320 critical support zone.
As long as the 9320 weekly pivotal support holds, the Index may see a push up to test the 10080/10120 resistance zone in first step. A break above 10120 is likely to trigger a further rally to target the next resistance at 10650.
However, failure to hold above the key 9320 pivotal support is likely to invalidate the expected recovery scenario for a continuation of the multi-month downtrend in place since 13 April 2015 high to target the next support at 8550.
Source: Charts are from eSignal & City Index Advantage Trader
Disclaimer
This report is intended for general circulation only. It should not be construed as a recommendation, or an offer (or solicitation of an offer) to buy or sell any financial products. The information provided does not take into account your specific investment objectives, financial situation or particular needs. Before you act on any recommendation that may be contained in this email, independent advice ought to be sought from a financial adviser regarding the suitability of the investment product, taking into account your specific investment objectives, financial situation or particular needs. All queries regarding the contents of this material are to be directed to City Index, a trading name of GAIN Capital Singapore Pte Ltd.
Trading CFDs and FX on margin carries a high level of risk that may not be suitable for some investors. Consider your investment objectives, level of experience, financial resources, risk appetite and other relevant circumstances carefully. The possibility exists that you could lose some or all of your investments, including your initial deposits. If in doubt, please seek independent expert advice. Visit cityindex.com.sg for the complete Risk Disclosure Statement.


