 (Click to enlarge charts)
What happened yesterday
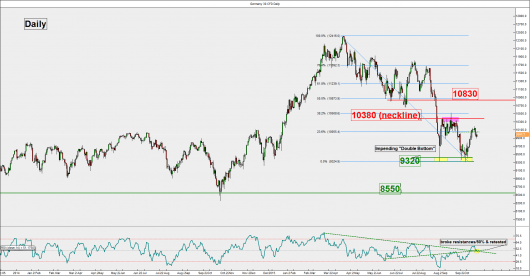
The Germany 30 Index (proxy for the DAX) has shaped that expected “last push down” and almost hit our expected downside target 9880 (printed a low of 9888) before trading sideways throughout the U.S. session.
Please click on this link for a recap on our previous daily outlook.
Key elements
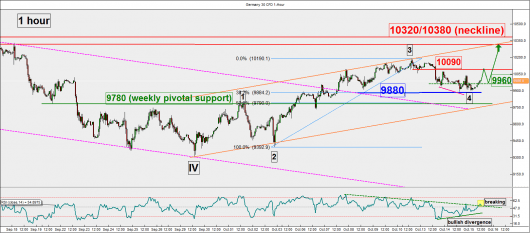
- The hourly (short-term) RSI oscillator is now attempting to break its trendline resistance (in dotted green) and the 50% neutrality level. Prior to this bullish breakout, the RSI has traced out a bullish divergence signal (higher lows in RSI versus lower lows in price action of Index) at its oversold region. These observations suggest a revival in upside momentum.
- In terms of Elliot Wave, the Index has appeared to have completed a corrective wave 4 down movement from the 12 October 2015 high @3pm at yesterday’s low of 9888. This 9888 low coincides closely with the 38.2% Fibonacci retracement level (a typical wave 4 target) from 02 October 2015 low @9pm to 12 October 2015 high @3pm at 9880.
- In conjunction with observations seen from other technical elements, the Index is now in the midst of undergoing the wave 5 (up move) of a bullish impulsive wave stricture of a larger degree in place since the low of 29 September 2015.
- The next significant resistance to watch will be at 10320/10380 which is defined by the neckline of the impending bullish “Double Bottom” chart formation in place since the “Black Monday”, 24 August 2015 low and the upper boundary of the short-term ascending channel from the 29 September 2015 low.
Key levels (1 to 3 days)
Intermediate support: 9960
Pivot (key support): 9880
Resistance: 10090 & 10320/10380
Next support: 9780 (weekly pivot)
Conclusion
Technical elements have turned bullish. As long as the 9880 daily (pivotal) support holds, the Index is likely to see a recovery at this juncture to retest the 10090 intermediate resistance before targeting the key 10320/10380 neckline resistance of the impending bullish “Double Bottom” chart formation.
On the flipside, failure to hold above the 9880 short-term pivotal support may negate the bullish tone to see another round of slide to test the 9780 weekly pivotal support.
Disclaimer
This report is intended for general circulation only. It should not be construed as a recommendation, or an offer (or solicitation of an offer) to buy or sell any financial products. The information provided does not take into account your specific investment objectives, financial situation or particular needs. Before you act on any recommendation that may be contained in this email, independent advice ought to be sought from a financial adviser regarding the suitability of the investment product, taking into account your specific investment objectives, financial situation or particular needs. All queries regarding the contents of this material are to be directed to City Index, a trading name of GAIN Capital Singapore Pte Ltd.
Trading CFDs and FX on margin carries a high level of risk that may not be suitable for some investors. Consider your investment objectives, level of experience, financial resources, risk appetite and other relevant circumstances carefully. The possibility exists that you could lose some or all of your investments, including your initial deposits. If in doubt, please seek independent expert advice. Visit cityindex.com.sg for the complete Risk Disclosure Statement.


