


AUD/USD Q2 2024 Outlook
Key points for the AUD/USD in Q2, 2024
- If commodity prices continue to soar, it diminishes the odds of central bank easing
- The RBA seem unlikely to cut rates in Q2 (or even Q3)
- The Fed have indicated three cuts this year, but incoming data is yet to support this dovish stance
- AUD/USD is holding up despite extremely bearish positioning on the futures market
- Q/Q volatility has been relatively low for the past five quarters, and competing dynamic forces could keep volatility capped in Q2
- We anticipated AUD/USD to trade between 62c-68c in Q2
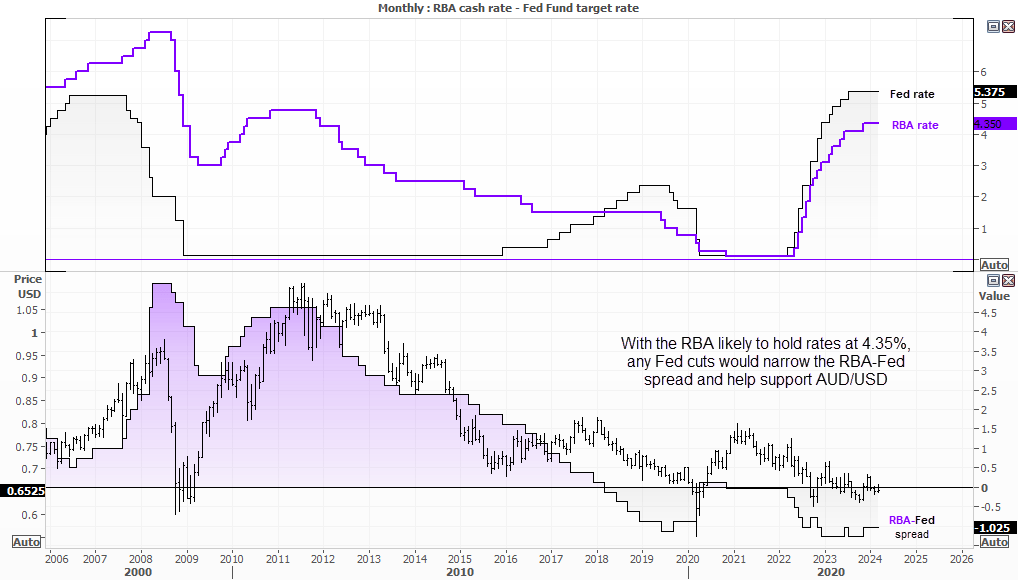
RBA – the most ‘reserved’ central bank of them all
Markets were excited at the prospects of the RBA cutting their cash rate when the central bank removed their slightly hawkish bias from their March statement. Yet within two days, bearish bets against the Australian dollar were reversed when a notably strong employment report arrived.
- Over 100k jobs were added in February according to the report, its fastest growth rate since late 2021
- The unemployment rate fell to 3.7% from 4%, and below its 12-month average.
These are not exactly the employment figures one would expect from a central bank that needs to cut their cash rate soon, especially when the RBA still maintain that inflation remains “too high”.
And when you consider that the RBA have some of the lowest rates among developed economies, they were the last central bank to hike rate and therefore likely to be one of the last to cut, a 4.35% cash rate appears set to stay for quite some time. And if the Fed cut rates, it would narrow the RBA-Fed rate differential and help support AUD/USD.
A surprisingly dovish Fed
The Fed surprised most with a relatively dovish meeting in March, where FOMC members retained their median forecast of three 25 basis points cuts in 2024. What makes this interesting is that the Fed don’t have much time at all for such easing, given they cannot be seen ‘meddling’ in the US election with policy changes too close to November.
We believe there is a reasonable chance the Fed will not be able to cut three times before the US November election, as any change to policy in October would be frowned upon which leaves just six months for 75bp of cuts.
Furthermore, consumer prices are rising once more, and employment remains strong by historical standards. This likely means that April's CPI data could be pivotal in shaping how traders view upcoming Fed policy decisions. Another set of strong employment figures and higher prices could crush expectations of three cuts, supporting US yields and the dollar, and consequently weighing on AUD/USD.
Besides, what will happen if rising inflation picks up its pace?
Don’t take your eye off of commodity prices
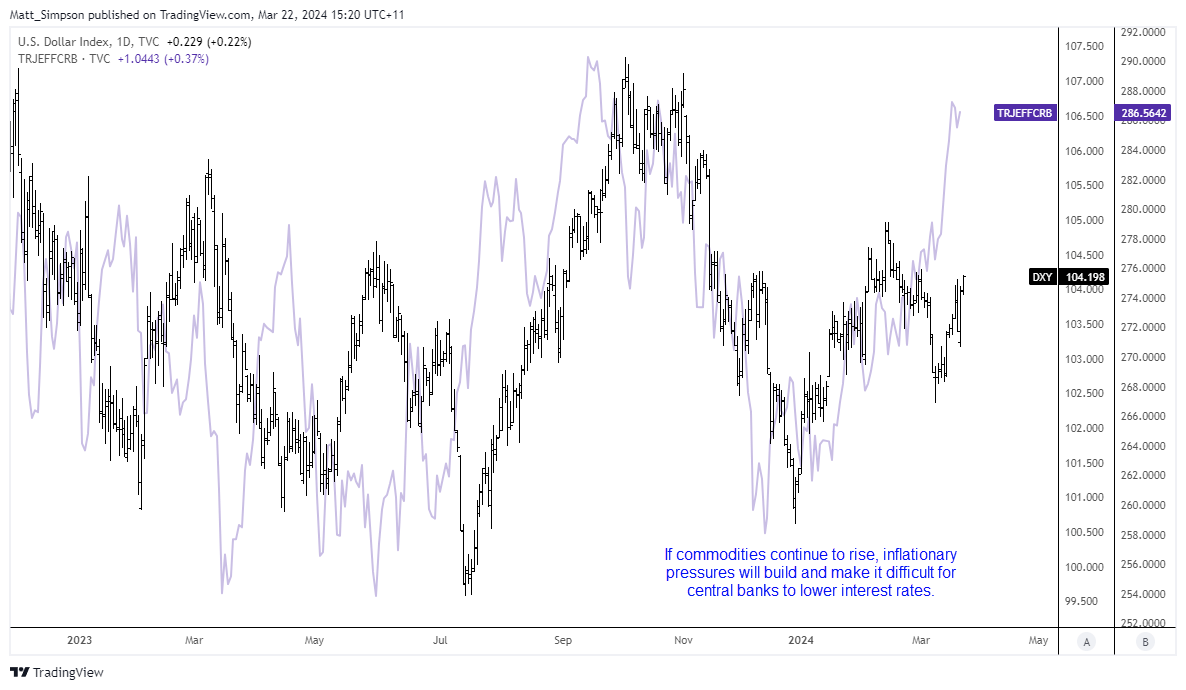
The risk of another round of inflation was always apparent heading into 2024. If you look back at previous spells of high inflation, they never arrive in single waves. And fears of another round of inflation are now resurfacing in the light of soaring commodity prices; because If commodity prices continue to surge, it could make it difficult for central banks to justify multiple cuts, or any easing at all.
The chart above shows the surge in commodities using the Thomson Reuters core commodity index. Their relationship is not perfect, but it does show a relatively strong correlation with the US dollar in recent times. It also suggests the US dollar could be undervalued relative to rising commodity prices, on the assumption that rising inflationary pressures could be hawkish for the Fed. And that could cap upside potential foe AUD/USD.
Q2 could tends to be more volatile than Q1
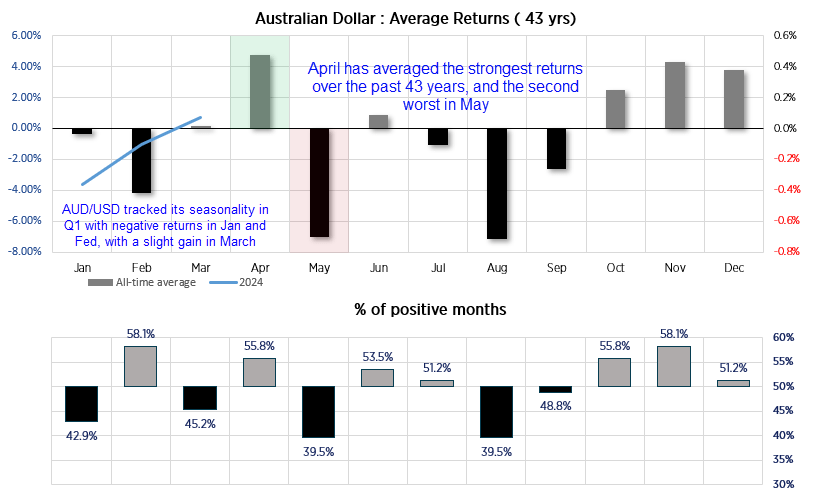
It's interesting to see that AUD/USD has more or less followed its seasonal pattern in Q1; January and February delivered negative returns with a slight increase in March. Where it differs is that heavier losses were sustained in January this year. If AUD/USD continues to follow its seasonal tendency, April could be set for strong gains. This is because the month has historically averaged the strongest positive returns over the past 42 years with a win rate of 55.8%. Conversely, May has averaged the second-worst monthly performance of the year, closing lower 60.5% of the time over the past 43 years. This pattern supports also the adage, "Sell in May and go away" usually associated with the stock market, but could also apply to AUD/USD as it moves in line with appetite for risk.
The downside for AUD/USD could be limited looking at market positioning
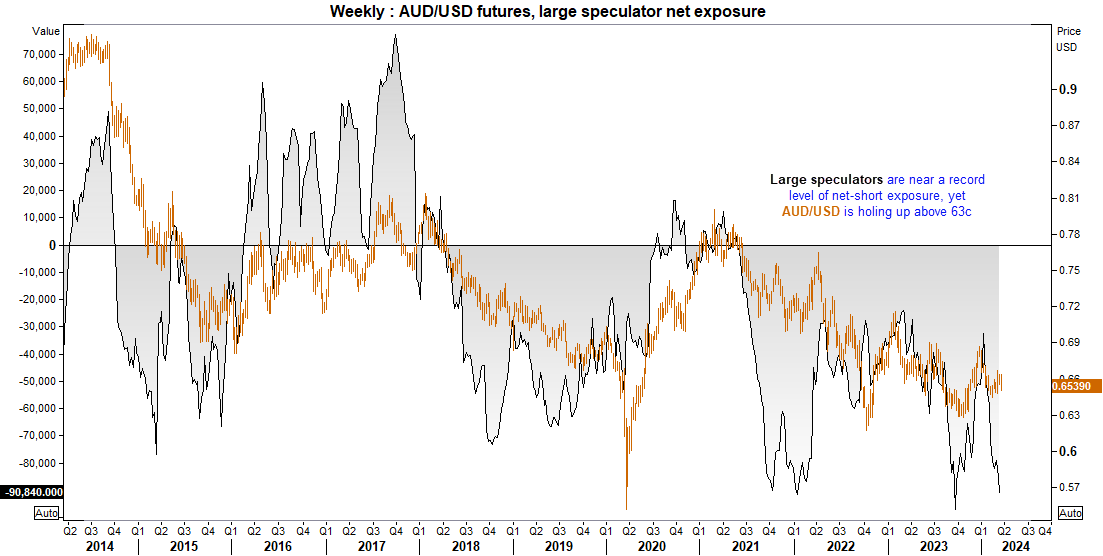
Large speculators are extremely net-short on AUD/USD futures, and in fact, they're near a record level of bearish exposure. The fact that AUD/USD is refusing to simply roll over and justify this extremely bearish sentiment suggests that prices need to either move lower quickly or bears will have to cover their positions, potentially triggering a short-covering rally. The Australian dollar is referred to as "the battler" with good reason.
AUD/USD technical analysis (quarterly chart):
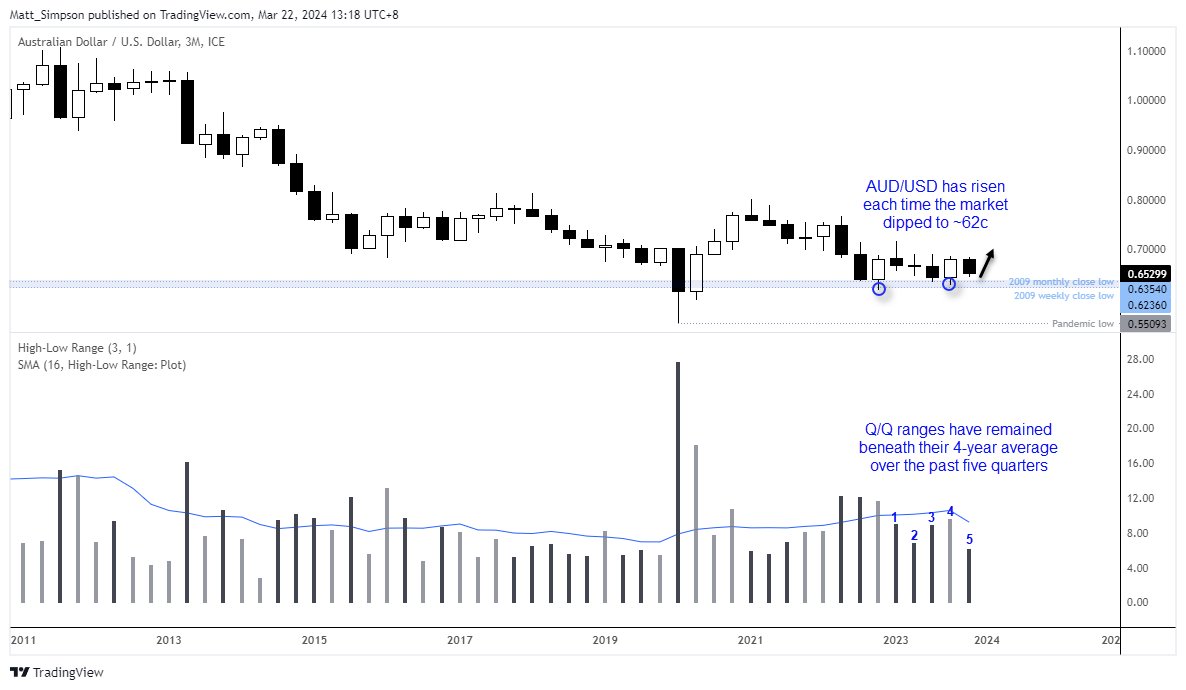
The quarterly chart shows that AUD/USD has essentially been range-bound between 62c and 70c over the past seven quarters. Despite the negativity AUD/USD has faced during this period, it has mostly managed to stay above the 2009 weekly and monthly close lows. Additionally, the market has rallied each time it has dipped toward the 62c area. Given its retracement of just over 4% in Q1 and that it is now approaching the 2009 lows, perhaps a rally in Q2 is possible, especially with seasonality also in its favour.
The 4-year average of the Q/Q percentage range is +/- 9.2%, which leaves the potential for some much larger moves should the correct catalyst arrive. If we simply extrapolate the +/- 9.2% range either side of 65c, we’re essentially looking at a minimum price of 59c for a bearish quarter versus 70c for a bullish quarter.
AUD/USD technical analysis (weekly chart):
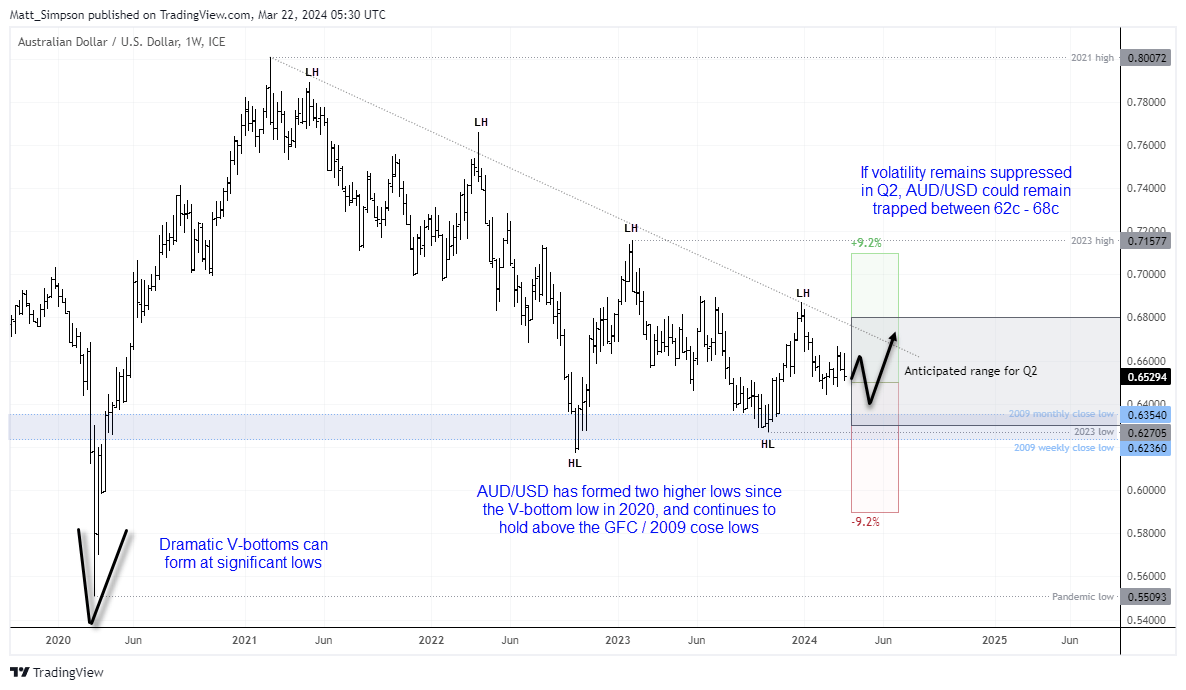
The weekly chart reveals a prominent V-bottom formed at the 2020 lows, and such patterns are often associated with significant market bottoms. Since then, the pair has formed two higher lows and, more recently, continues to hold above the 2009 lows established following the GFC. Its ability to maintain a price above 62c, despite extreme net-short exposure and periods of negative sentiment, demonstrates its underlying strength.
Assuming AUD/USD is to remain stuck between the competing forces of US and domestic data, monetary policies and rising commodity prices, we suspect a more realistic range for Q2 is between 62c – 68c.
Of course, a caveat here is that this analysis assumes global markets are not in a meltdown. A widespread market downturn would likely be bearish for the AUD/USD pair during such periods of risk aversion. Moreover, a weekly close below 62c would bring 60c into focus, and a weekly close beneath that level would be very significant indeed.
Until then, the bias remains to buy dips towards the 62c – 63c area for an anticipated move towards 67c.