USD JPY attempts triangle breakout
USD/JPY (daily chart) has attempted to break out above a large triangle consolidation pattern that has been in place for more than five months since […]
USD/JPY (daily chart) has attempted to break out above a large triangle consolidation pattern that has been in place for more than five months since […]
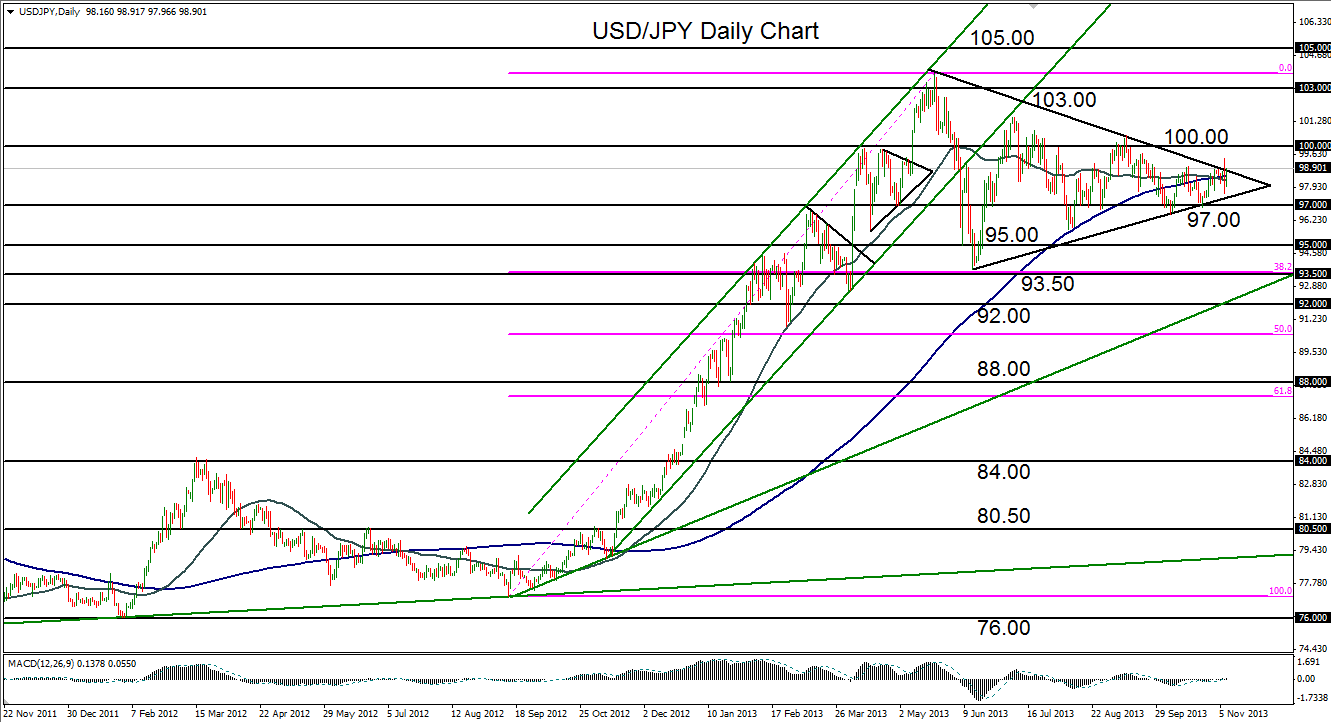
USD/JPY (daily chart) has attempted to break out above a large triangle consolidation pattern that has been in place for more than five months since the multi-year high of 103.72 was hit in May. The pair broke out tentatively yesterday, hitting a high of 99.40, before pulling back. The upper border of this triangle extends from the May 103.72 high and connects the September high at 100.60 to the highs of the past week. During the course of this narrowing consolidation, volatility progressively decreased and the 50-day/200-day moving averages converged and crossed slightly. This provided an indication that volatility was near its low extreme and there was the potential for a breakout of the triangle consolidation.
Yesterday’s tentative upside breakout could develop into a larger breach, especially if the pair goes on to break out above the key 100.00 resistance level. If that is to be the case, the clear upside objectives are the 103.00 resistance level and then a re-test of the noted 103.72 multi-year high. Strong downside support continues to reside around the 97.00 level, which was last tested and respected just two weeks ago.