GBP USD Pulls Back to Key Support
GBP/USD (daily chart shown below) has pulled back sharply in the past two weeks from its new 2015 high of 1.5813 that was reached in […]
GBP/USD (daily chart shown below) has pulled back sharply in the past two weeks from its new 2015 high of 1.5813 that was reached in […]
GBP/USD (daily chart shown below) has pulled back sharply in the past two weeks from its new 2015 high of 1.5813 that was reached in mid-May. Currently, this pullback has brought the currency pair back down to dip below its key support target of 1.5250.
In the process of this breakdown, GBP/USD has dropped below several support factors, including the 1.5500 level, an uptrend line running from mid-April to late May, and the 200-day moving average.
In doing so, the currency pair has given back a good portion of the gains made during the most recent rebound and partial recovery that occurred in April and May.
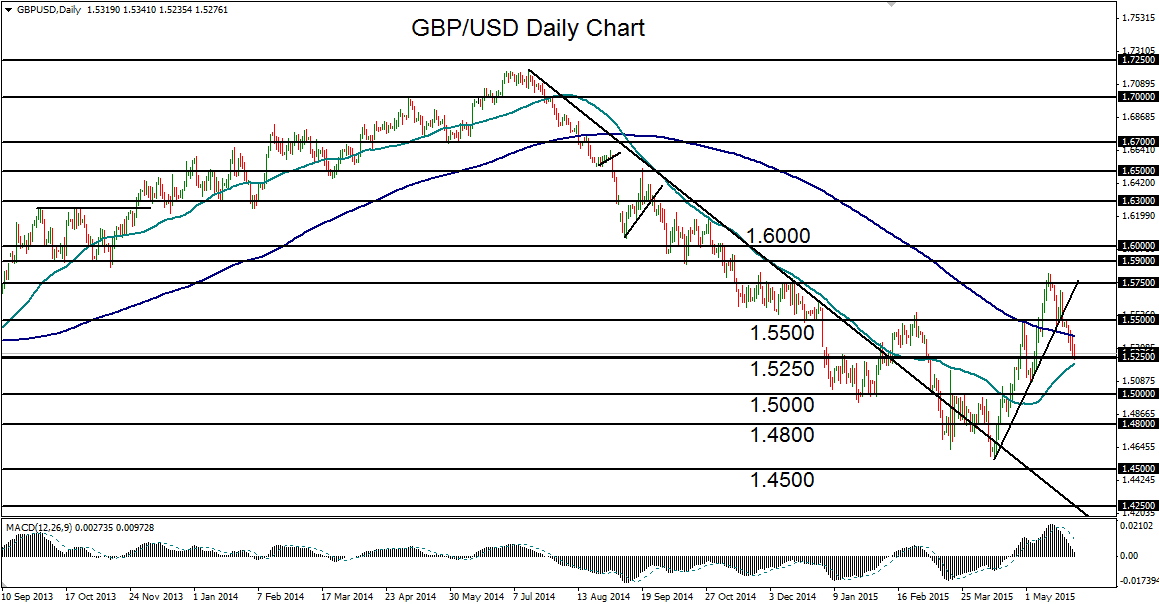
Having pulled back so sharply from this partial recovery in the midst of renewed US dollar strength within the past two weeks, GBP/USD is currently trading at a critical juncture between its 200-day moving average to the upside and its 50-day moving average to the downside.
Still entrenched within a longer-term bearish trend that originated from the 1.7190 high in July of last year, the currency pair could be poised to reassert this downtrend.
A sustained break below the noted 1.5250 support area could lead to a breakdown below the 50-day moving average and a subsequent targeting of further downside support objectives at 1.5000 and then 1.4800.
