H2 Commodities Market Outlook
Gold
Our bullish bias for gold has so far exceeded expectations, having come close to breaking its record high in May. Seemingly false hopes that central bank rates were at or near their peak weighed on yields and the US dollar, helping gold prices to surge. Yet with central banks renewing their hawkish vows as ‘there is more work to be done’ to fight inflation, gold is now selling off accordingly. And its selloff has not come without warning.
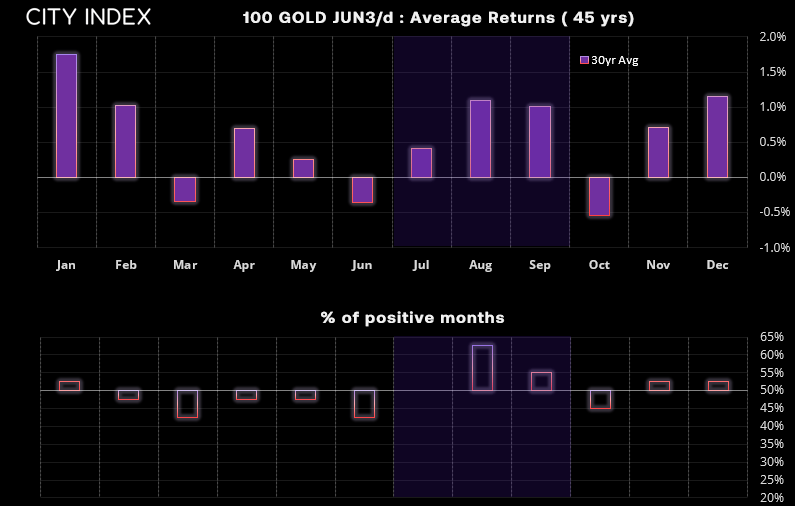
Two prominent bearish hammer candles formed in April and May just beneath the record high ahead of June’s selloff. Furthermore, gold has posted negative returns on average in June over the past 45 years, closing lower 57.5% of the time in that month. Central bank hikes and fears of a recession could prompt some investors to move to cash and weigh further on prices over the near-term, especially if we see indices pull back meaningfully from their cycle highs.
Yet we see these moves as part of a much-needed correction and will look out for evidence of support above $1800. Gold has averaged positive returns in Q3 over the past 40 years with August enjoying a 62.5% win rate. Large speculators and asset managers remain net long gold futures, and the futures curve points higher.
According to the World Gold Council in May, gold ETF demand flipped to positive YTD and 24% of central banks surveyed expect to increase their gold reserves over the next 12 months. As we head into Q4 the threat of inflation could have diminished, removing the threat of higher interest rates and supporting gold prices.
Gold futures (GC) weekly chart:
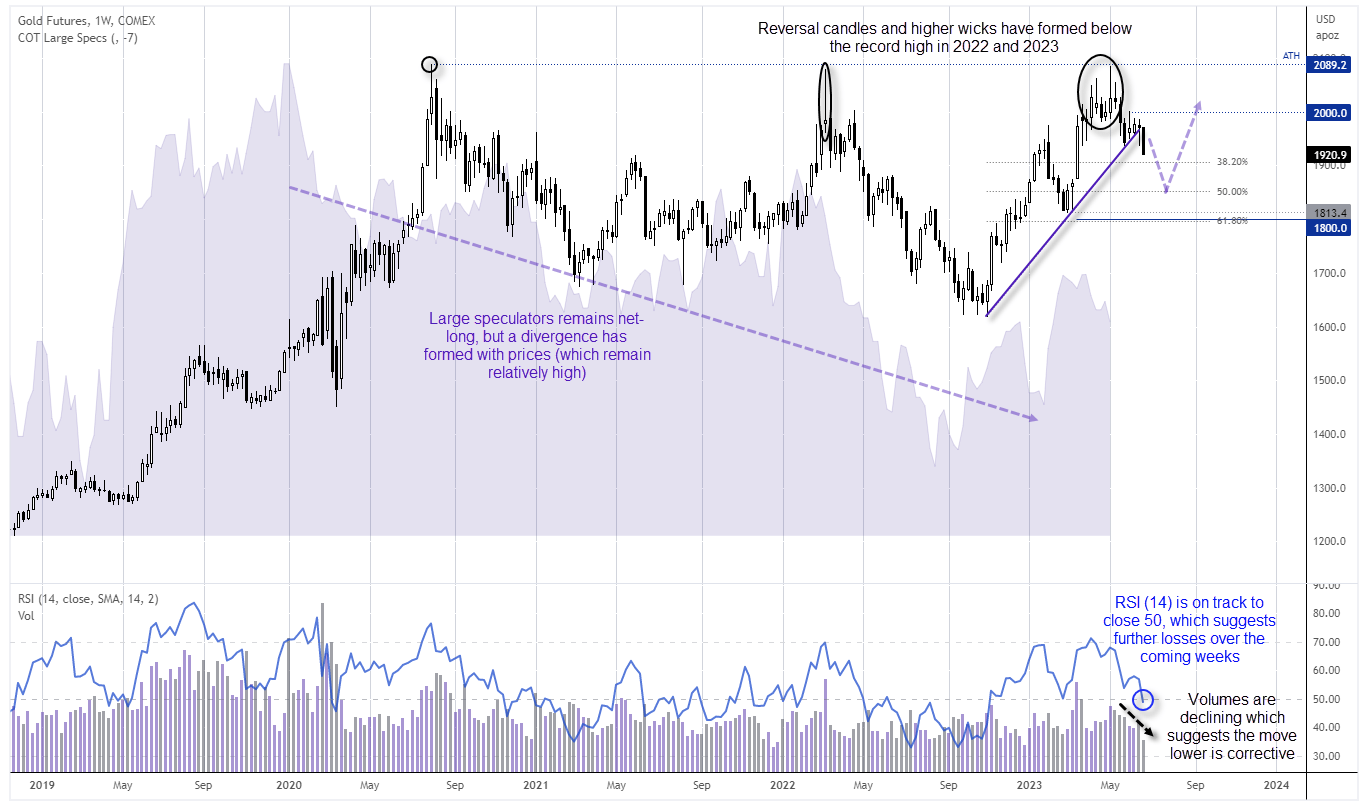
While gold came close to its record high, the bearish reversal candles and higher wicks in 2022 and 2023 show that it was tough at the top, with no weekly close above $2030. Momentum has since turned lower and prices have now broken trend support.
Large speculators remain net-long gold futures, but it has formed a bearish divergence with prices since 2020 to suggest more bullish bets are required to support the rally – or prices need to move lower. RSI (14) is on track to close below 50 to show negative momentum which favours further losses over the coming weeks. Yet with volumes trending lower since May, the downside may be limited and investors could be tempted to re-enter the gold market around support levels such as $1800 (near the February lows and 61.8% Fibonacci level) and 50% retracement level around $1850).
Conclusion
We expect gold prices to remain under pressure as we make our way through Q3, whilst central banks continue to threaten markets with higher rates as they fight inflation. Yet with central banks and ETF flows supporting prices, we’re not expecting a significant selloff. We therefore expect gold can hold above $1800 and break above $2000 as we get further towards Q4.
Oil
In our H1 commodities outlook, we outlined a scenario for WTI to hold above $60 and its volatility to be much lower than 2022’s roller coaster ride. Having since held above $65 and remaining confined to a ~20% range, its lacklustre performance has been regrettably in line with expectations. And unless the global economy accelerates towards a hard landing, we expect H2 to be a similar affair.
OPEC+ supported prices via production cuts whilst Saudi Arabia sent a stern warning to bearish speculators, and dwindling demand forecasts capped rallies. This has placed an artificial floor above $60, but production cuts have not been enough to offset concerns of a recession or China’s underwhelming recovery.
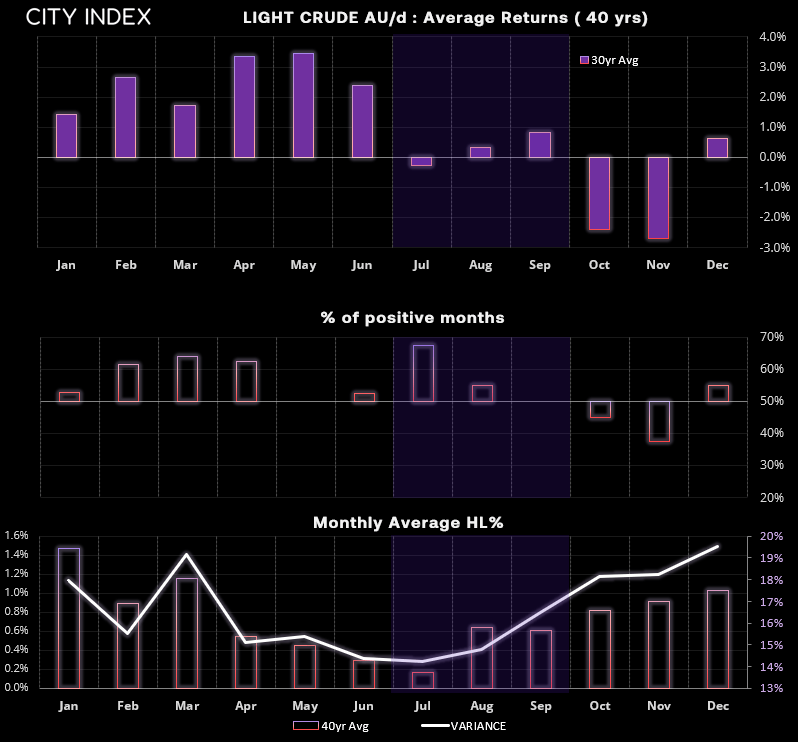
But we also entered a period of year notorious for lower ranges. Over the past forty years, some of the smallest monthly ranges arrived in May and June (with the lowest being July). And whilst August and September posted positive average returns, gains are relatively small and the win ratio is low. We could therefore be in for some choppy trade, but with prices drifting to the lows of its range then we might see prices pop higher again unless we enter an economic meltdown.
WTI crude weekly chart:
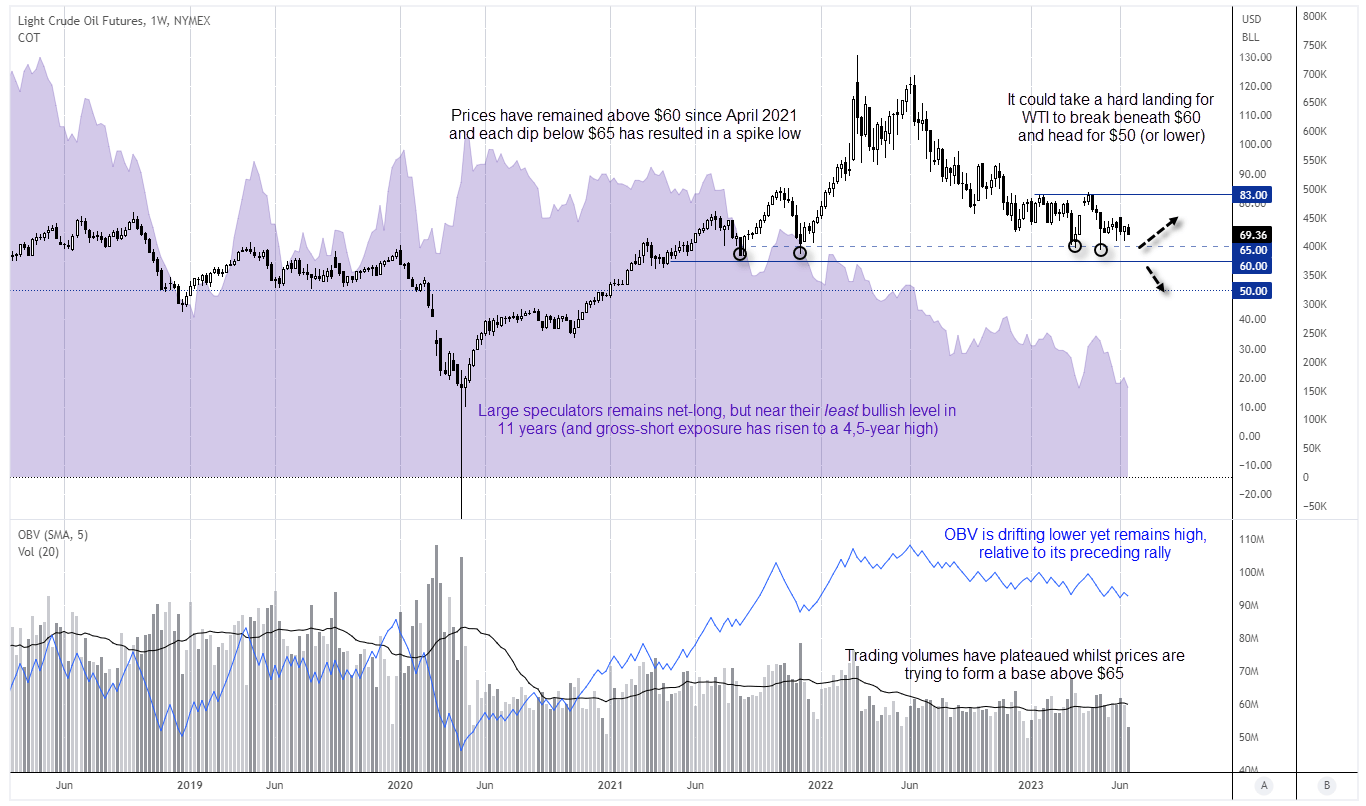
Large speculators remain net-long WTI futures, yet at their least bullish level in 11 years. Gross-short exposure has also risen to a 4.5-year high.
The OBV indicator (on balance volume) is drifting lower with prices, yet it still remains elevated by historical standards. Furthermore, the 20-week MA of trading volumes has flatlined, which suggests a lack of enthusiasm from the bear camp while prices are seemingly trying to form a base above $65. On that note, prices have remained above $60 since April 2021 and a spike low has formed each time WTI prices have dipped below $65.
Overall, it appears that prices remain supported above the $60 - $65 area which suggests prices could revert towards the midway point of the $60 - $80 range in the coming weeks.
Conclusion
It is difficult to construct a bullish case for oil in the second half of 2023, whilst global growth trends lower and central banks maintain higher interest rates in an inflationary environment. If a soft landing is in order, then the downside is also limited – with OPEC+ seemingly on hand to support prices in the $60-$70 range. Therefore, unless a full-blown recession kicks off, it seems oil could range between $60 - $80 for the remainder of the year.