


GBP/USD Outlook
GBP/USD registers a fresh year high (1.2547) following the lager-than-expected decline in US Retail Sales, but the recent rally in the exchange rate appears to have stalled ahead of the June 2022 high (1.2617) as it snaps the series of higher highs and lows from the start of the week.
GBP/USD rally halted ahead of June 2022 high
GBP/USD cleared the opening range for April earlier this week as it staged a three-day rally, but the bullish momentum may continue to abate as the Relative Strength Index (RSI) seems to be reversing ahead of overbought territory.
Join David Song for the Weekly Fundamental Market Outlook webinar. Register Here
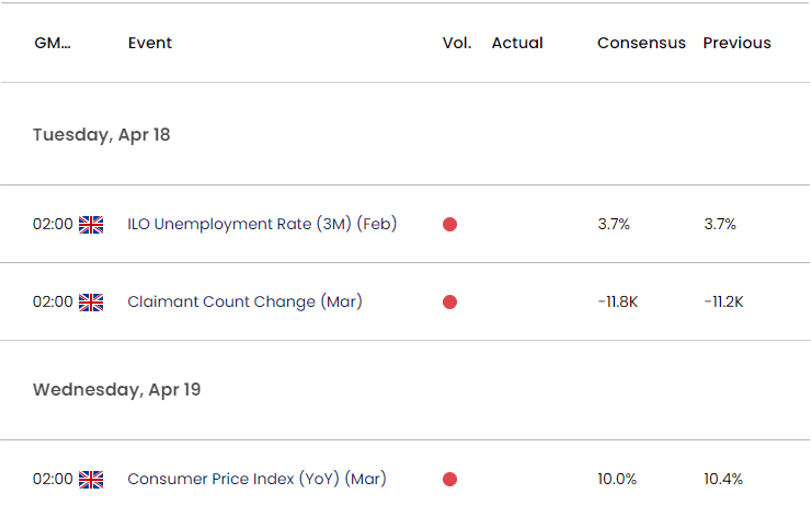
Looking ahead, data prints coming out of the UK may sway GBP/USD as the Claimant Count report is anticipated to show claims for unemployment benefits falling for the fourth consecutive month in March, while the Consumer Price Index (CPI) it seen narrowing to 10.0% from 10.4% per annum in February.
Signs of a tight labor market may generate a bullish in the British Pound as it raises the Bank of England’s (BoE) scope to pursue a more restrictive policy, but evidence of disinflation may lead to a growing dissent within the Monetary Policy Committee (MPC) as Governor Andrew Bailey and Co. insist that ‘it remains likely to fall sharply over the rest of the year.’
In turn, GBP/USD may face headwinds ahead of the next BoE rate decision on May 11 should the developments coming out of the UK spark bets for a change in regime, and the exchange rate may continue to give back the advance from the monthly low (1.2275) as it snaps the series of higher highs and lows from the start of the week.
With that said, the failed attempt to test the June 2022 high (1.2617) may lead to a near-term pullback in GBP/USD, but the weakness may end up being temporary if the exchange rate manages to hold above the monthly low (1.2275).
British Pound Price Chart – GBP/USD Daily
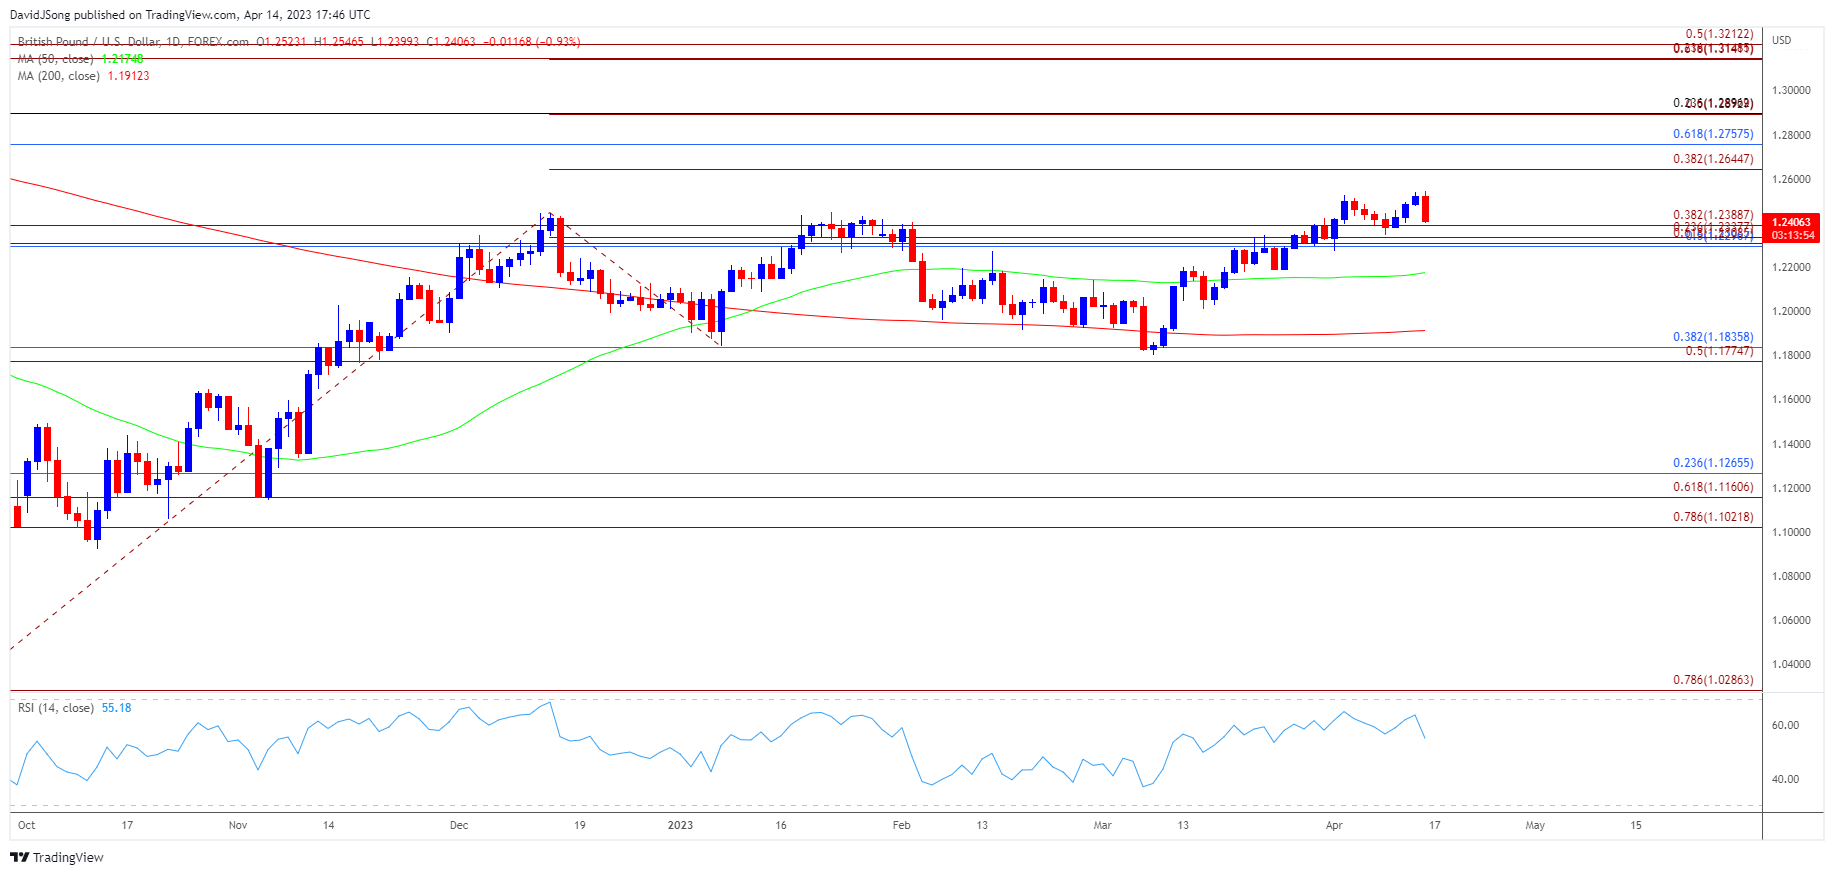
Chart Prepared by David Song, Strategist; GBP/USD on TradingView
- GBP/USD cleared the opening range for April to register a fresh year high (1.2547), but the recent rally appears to have stalled ahead of the June 2022 high (1.2617) as the exchange rate snaps the series of higher highs and lows from the start of the week.
- The Relative Strength Index (RSI) reflects a similar dynamic as it continues to hold below 70 and appears to be reversing ahead of overbought territory.
- In turn, GBP/USD may fall towards the 1.2300 (50% Fibonacci retracement) to 1.2390 (38.2% Fibonacci extension) region, with a break below the monthly low (1.2275) raising the scope for a move towards the 50-Day SMA (1.2175).
- Nevertheless, GBP/USD may stage further attempts to test the June 2022 high (1.2617) if it defends the monthly low (1.2275), with a break/close above 1.2650 (38.2% Fibonacci extension) opening up the 1.2760 (61.8% Fibonacci retracement) area.
--- Written by David Song, Strategist
Follow me on Twitter at @DavidJSong
Latest market news
Yesterday 06:37 AM
April 26, 2024 01:25 PM
April 26, 2024 11:40 AM
Latest GBP/USD articles

April 16, 2024 07:49 AM

April 8, 2024 10:46 AM

February 28, 2024 08:23 PM
February 19, 2024 03:54 PM