Lloyds Earnings What to Watch
Provisions for mis-selling PPI have been a key theme for British lenders this earning season. A surge of last-minute PPI claims prior to the August cut-off date will be reflected in Lloyds results and are expected to dent the bottom line.
The extra costs have knocked the investment case for Lloyds, hitting return on equity, inhibiting the banks’ ability to build capital buffers and to distribute cash.
With the deadline of 29th August now behind us Lloyds should be able to draw a line in the sand over PPI.
The low interest rate environment has been less that conducive for UK banks, negatively impacting net interest income (NII). Interest margins have also been under pressure amid increasing competition, particularly in the mortgage market. With net interest margins falling, profits are taking a hit.
With Brexit uncertainty still lingering and inflation falling, the next move by the BoE is more likely to be a rate cut than a rate rise. Potentially meaning more pressure on NII going forward.
Impairment costs
Bad loan write downs are on the increase across the big 5 FTSE 100 banks, albeit at a low level. Investors and analysts alike will be keeping an eye on this. A continued increase could indicate that borrowers are struggling, a concern for Lloyds and the wider economy.
Brexit
Brexit uncertainty is set to continue for some time yet. This means that Lloyds and the wider UK banking sector will continue to experience unpredictability. Whilst a no deal Brexit would be very damaging to Lloyds, the continual delay of Brexit is a drag on the stock.
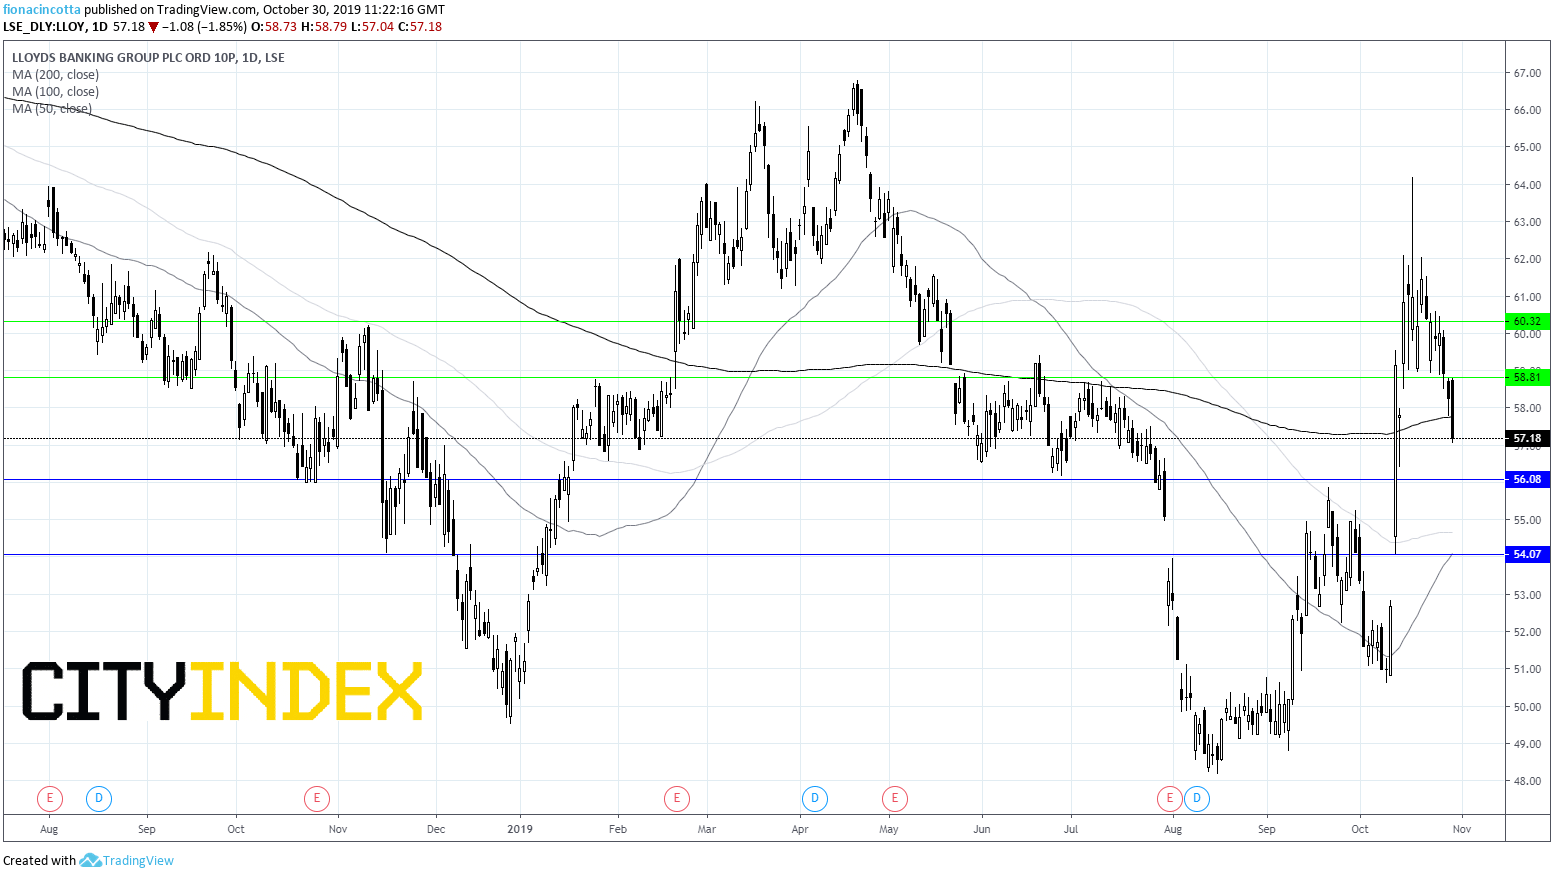
Lloyds levels to watch:
Despite it’s fair share of headwinds, Lloyds is trading 12% higher across the year. It has rallied over 9% in the last 3 months as the chances of a no deal Brexit decrease. Lloyds on the daily chart trades above its 50 & 100 sma, and is just marginally below the 200 sma.
Support can be seen at 56p and 54p. On the upside a break above 58.8p could open the doors to 60.3p.
From time to time, StoneX Financial Pty Ltd (“we”, “our”) website may contain links to other sites and/or resources provided by third parties. These links and/or resources are provided for your information only and we have no control over the contents of those materials, and in no way endorse their content. Any analysis, opinion, commentary or research-based material on our website is for information and educational purposes only and is not, in any circumstances, intended to be an offer, recommendation or solicitation to buy or sell. You should always seek independent advice as to your suitability to speculate in any related markets and your ability to assume the associated risks, if you are at all unsure. No representation or warranty is made, express or implied, that the materials on our website are complete or accurate. We are not under any obligation to update any such material.
As such, we (and/or our associated companies) will not be responsible or liable for any loss or damage incurred by you or any third party arising out of, or in connection with, any use of the information on our website (other than with regards to any duty or liability that we are unable to limit or exclude by law or under the applicable regulatory system) and any such liability is hereby expressly disclaimed.
City Index is a trading name of StoneX Financial Pty Ltd.
The material provided herein is general in nature and does not take into account your objectives, financial situation or needs.
While every care has been taken in preparing this material, we do not provide any representation or warranty (express or implied) with respect to its completeness or accuracy. This is not an invitation or an offer to invest nor is it a recommendation to buy or sell investments.
StoneX recommends you to seek independent financial and legal advice before making any financial investment decision. Trading CFDs and FX on margin carries a higher level of risk, and may not be suitable for all investors. The possibility exists that you could lose more than your initial investment further CFD investors do not own or have any rights to the underlying assets.
It is important you consider our Financial Services Guide and Product Disclosure Statement (PDS) available at www.cityindex.com/en-au/terms-and-policies/, before deciding to acquire or hold our products. As a part of our market risk management, we may take the opposite side of your trade. Our Target Market Determination (TMD) is also available at www.cityindex.com/en-au/terms-and-policies/.
StoneX Financial Pty Ltd, Suite 28.01, 264 George Street, Sydney, NSW 2000 (ACN 141 774 727, AFSL 345646) is the CFD issuer and our products are traded off exchange.
© City Index 2024