FAANGs Earnings In Focus
Facebook Q2 – 29th July
All eyes will be on advertising revenue when Facebooks reports Q2 earnings. FB reports as some big brands officially boycott Facebook advertising over its policy on misinformation and hate speech. Recent data shows US online ad spend points to a stronger than forecast recovery. Facebook’s daily active users climbed 11% in Q1 and could perform well again in Q2 amid the stay at home order. FB’s expansion into the booming e-commerce world will also be closely eyed with stores now easily created in Facebook and on Instagram. Broadly speaking analysts are optimistic.
Expectations are for quarterly EPS of $1.44 (+58%) on revenue of $17.31 billion (+2.5%)
Chart Thoughts
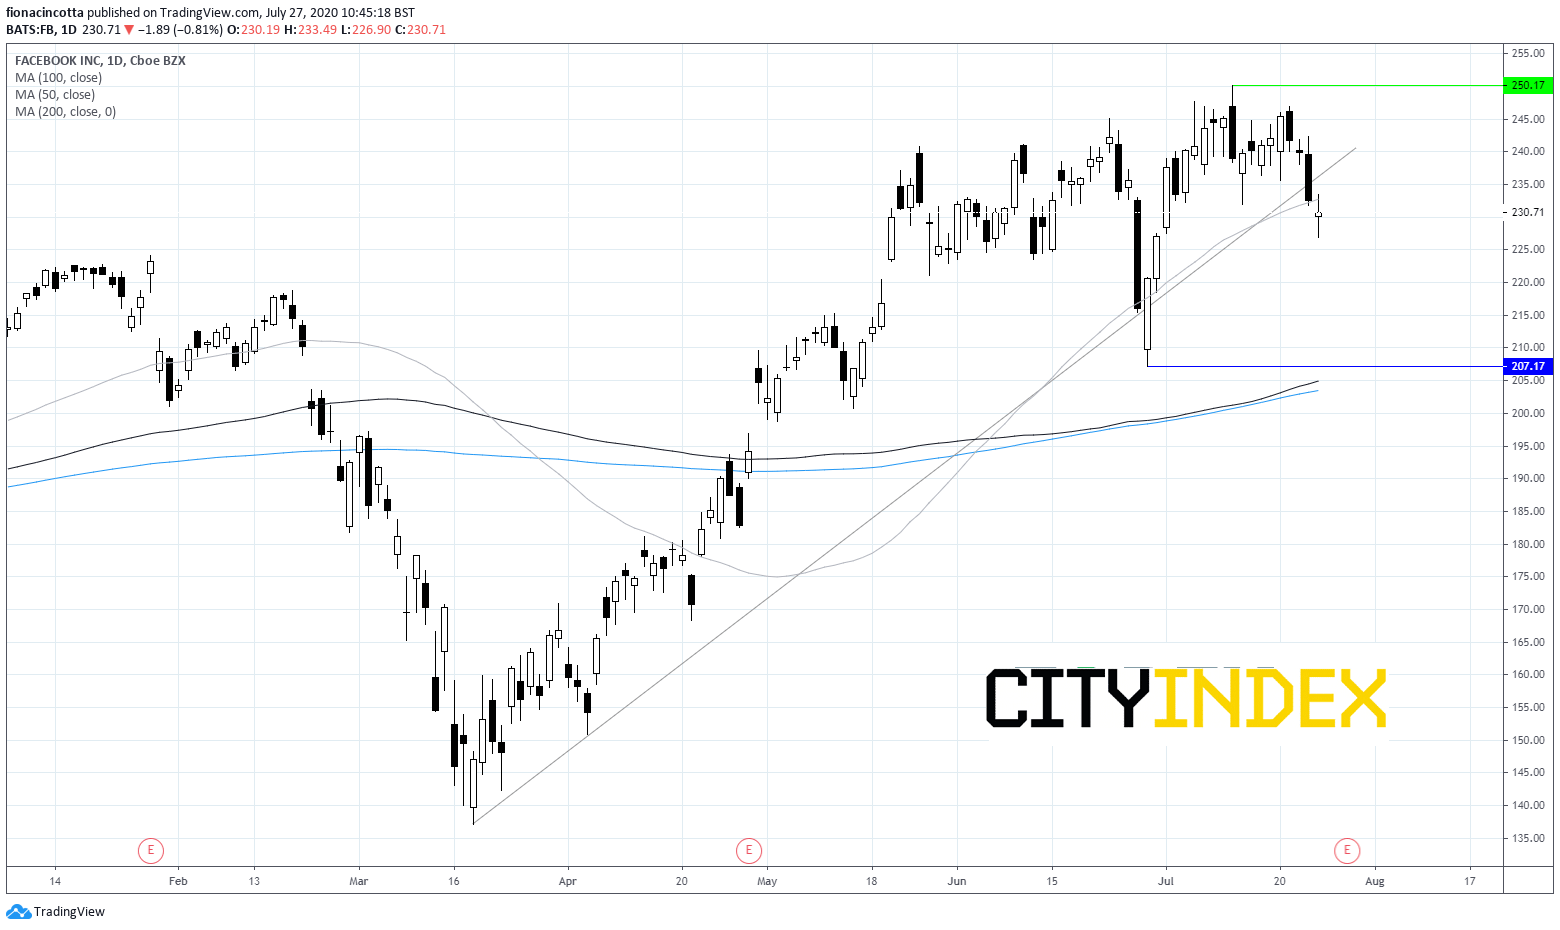
After hitting an all time high of $250 two weeks ago FB has fallen lower, slipping below its ascending trendline and 50 daily moving average suggesting that more weakness could be on the cards. If FB fails to retake the ascending trendline at $234, we could see a steeper sell off towards the key support at $205 (low 29th June & 100 & 200 sma)
Alphabet Q2 – 30th July
Google parent Alphabet is expected to report year on year decline in earnings on lower revenue. As with Facebook, advertising revenue will be in focus. April – June is expected to be the nadir for ad spend as marketing budgets are cut. Recent data shows that ad spend is starting to pick up. Alphabet has more than one string to its bow and could also benefit from consumers spending more time at home, on YouTube and Google Cloud platform which are now driving more than 50% of total sales. FactSet project that Google Cloud Platform will generate $12.9 billion in 2020 making it a significant factor in Alphabet’s growth but one that is perhaps undervalued by investors.
Expectations for quarterly EPS of $8.43 (-40% yoy) on revenues $30.66 billion (-3.3% yoy)
Chart thoughts
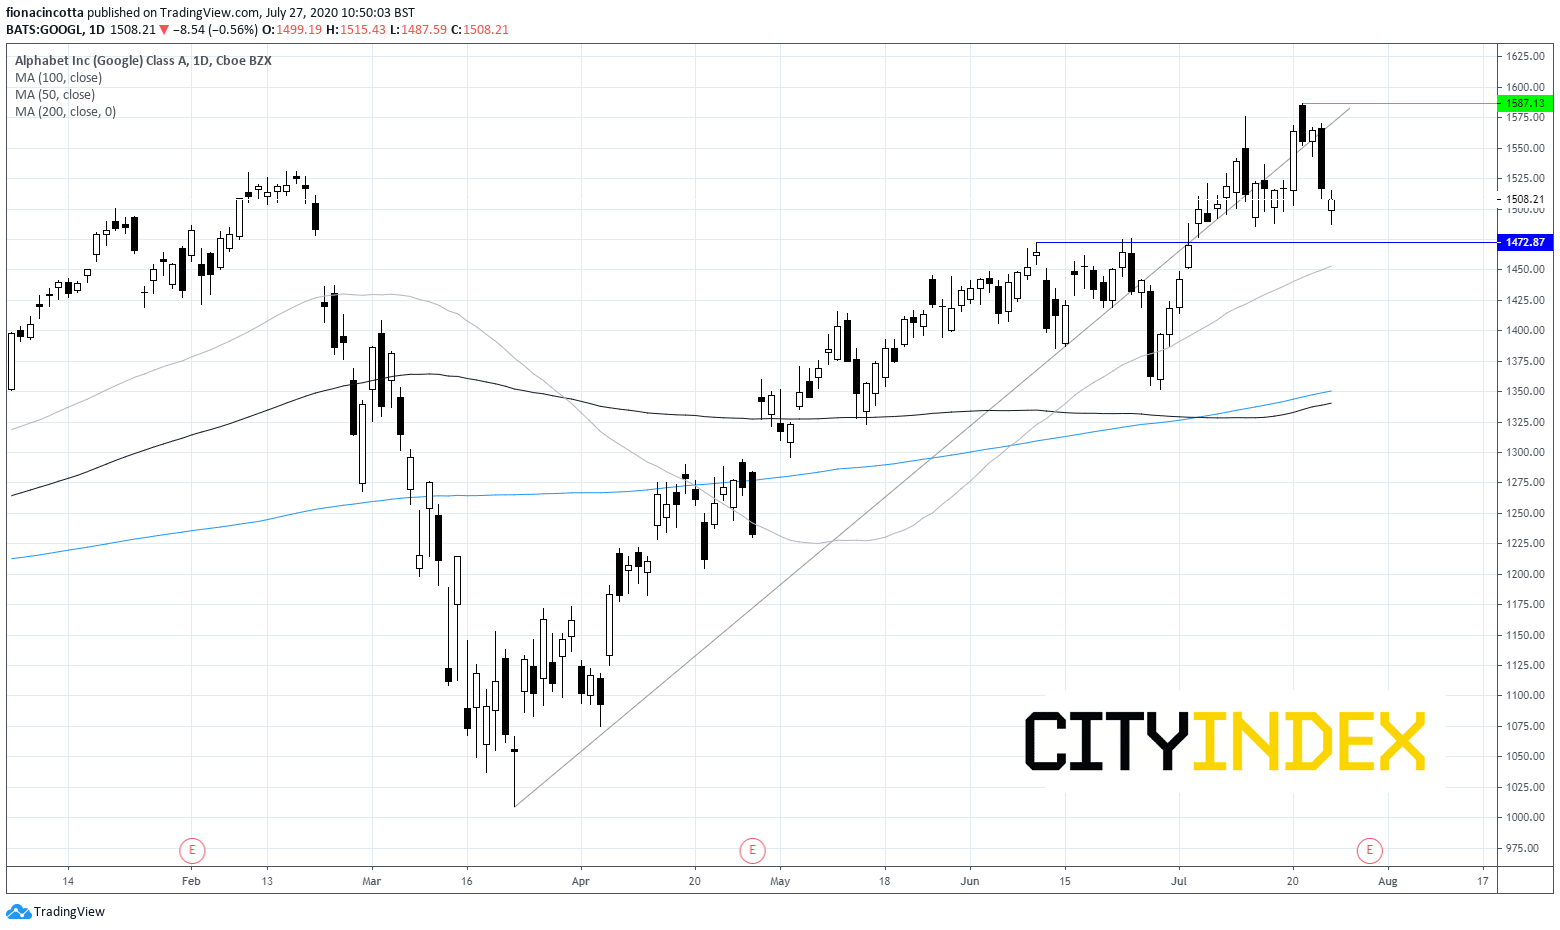
Alphabet has had a phenomenal rally from mid-March lows, soaring 57% to an all-time high of$1587 last week. Since then the stock has looked less certain dropping below its ascending trendline, although it remains firmly above its 50, 100 and 200 sma suggesting that there could be more upside on the cards still. We would be looking for a move back over the ascending trendline around $1560 to confirm a bullish trend. Otherwise a test of support at $1470 (July low) could open the doors to 50 sma at $1450.
Apple Q3 – 30th July
Apple is due to report Q3 earnings. It’s share price has had a phenomenal run since March lows but is showing signs of cracking heading into results. With expectations sky high the risk of disappointment also runs high. iPhone sales are forecast at $22.4 billion down by 13.8%, services and wearables are expected to see revenue grow 15% to $13.2 billion and 5% $5.97 billion respectively. If the service business segment does grow by 15% this would be the slowest rate of growth since Q3 2019, perhaps calling into question its sky high share price.
Expectations for quarterly EPS of $2.02 (-7.3%) on revenue of $51.7 billion (-3.8%)
Chart Thoughts
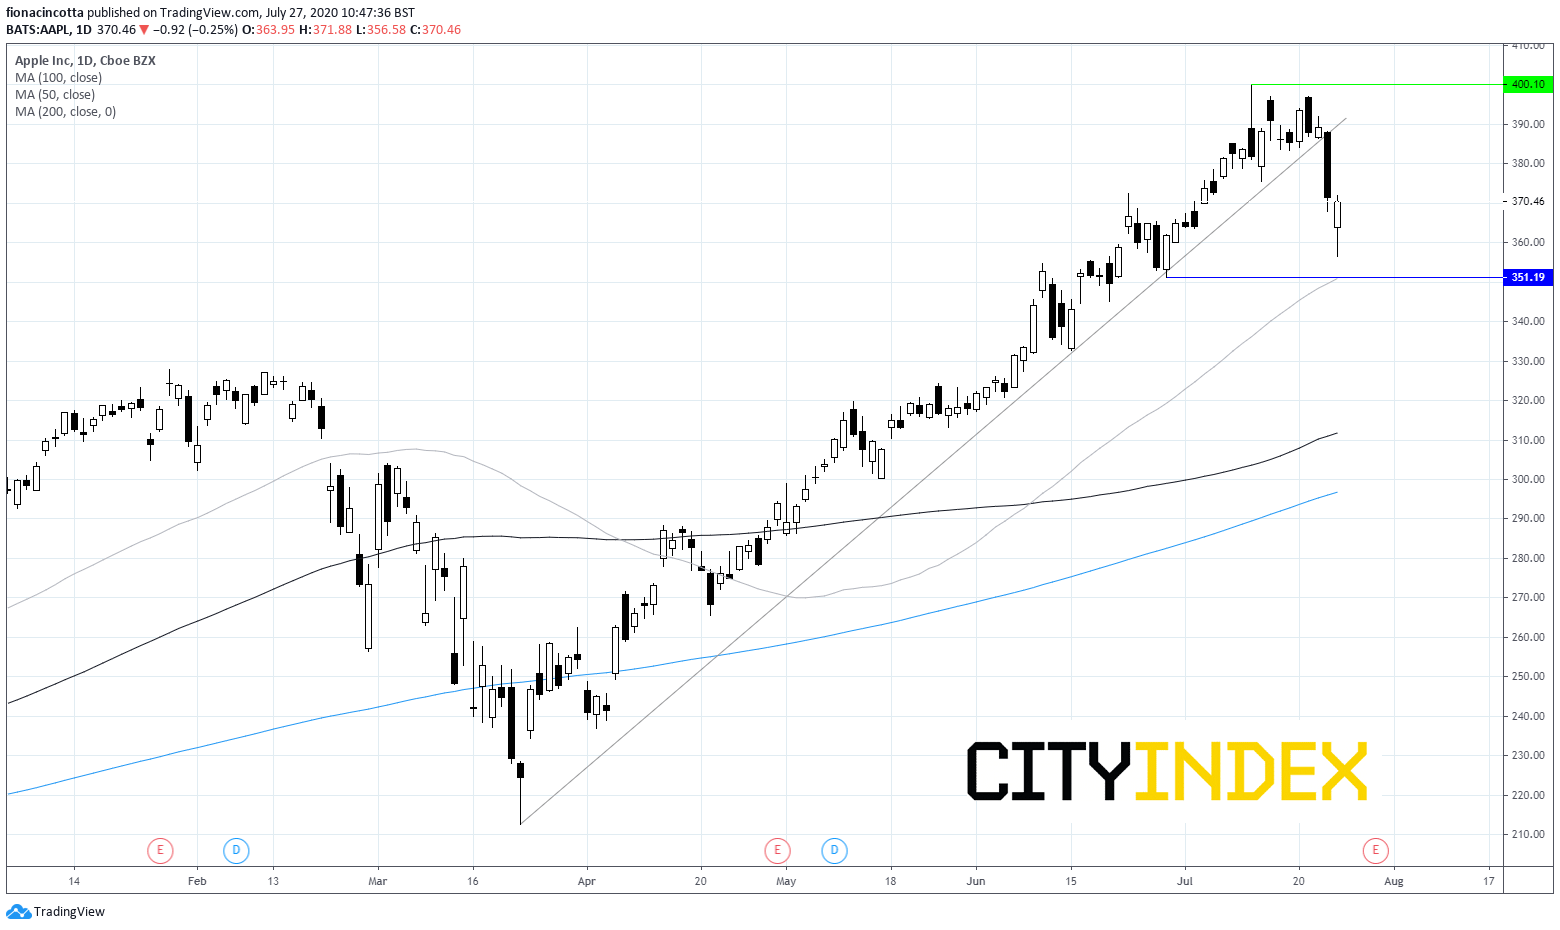
Apple is trading up 79% year to date. However, after reaching an all time high of $400, the stock has been in decline dropping through its ascending trendline and heads straight for its 50 day moving average at $350. Failure of this level to hold could see a deeper sell off back towards the $320 pre-covid level before opening the doors to 100 sma close to $310.
Amazon
The stock reports as it is trading more than 55% higher YTD boosted by its e-commerce strength and its AWS cloud platform. Costs will once again be under the spotlight in Q2 earnings, particularly after Jeff Bezos said that he was less focused on near term profits, instead prioritizing improving the customer experience. Earnings come at a time when investors are starting to rotate out of stay at home stocks into value stocks. Expectations are for EPS $1.63 on revenue of $63.40 billion.
Chart thoughts
Whilst Amazon might have dropped sharply across the previous week, the stock remains above its 50, 100 and 200 daily moving averages and just above its ascending trendline as it finds support at the key psychological $3000 mark. Should this level hold we could see the stock look to take on its all-time high of $3344.
On the flip side, immediate resistance from the ascending trendline can be seen around the $2920 level, prior to support at $2800 and around $2630.
From time to time, StoneX Financial Pty Ltd (“we”, “our”) website may contain links to other sites and/or resources provided by third parties. These links and/or resources are provided for your information only and we have no control over the contents of those materials, and in no way endorse their content. Any analysis, opinion, commentary or research-based material on our website is for information and educational purposes only and is not, in any circumstances, intended to be an offer, recommendation or solicitation to buy or sell. You should always seek independent advice as to your suitability to speculate in any related markets and your ability to assume the associated risks, if you are at all unsure. No representation or warranty is made, express or implied, that the materials on our website are complete or accurate. We are not under any obligation to update any such material.
As such, we (and/or our associated companies) will not be responsible or liable for any loss or damage incurred by you or any third party arising out of, or in connection with, any use of the information on our website (other than with regards to any duty or liability that we are unable to limit or exclude by law or under the applicable regulatory system) and any such liability is hereby expressly disclaimed.
City Index is a trading name of StoneX Financial Pty Ltd.
The material provided herein is general in nature and does not take into account your objectives, financial situation or needs.
While every care has been taken in preparing this material, we do not provide any representation or warranty (express or implied) with respect to its completeness or accuracy. This is not an invitation or an offer to invest nor is it a recommendation to buy or sell investments.
StoneX recommends you to seek independent financial and legal advice before making any financial investment decision. Trading CFDs and FX on margin carries a higher level of risk, and may not be suitable for all investors. The possibility exists that you could lose more than your initial investment further CFD investors do not own or have any rights to the underlying assets.
It is important you consider our Financial Services Guide and Product Disclosure Statement (PDS) available at www.cityindex.com/en-au/terms-and-policies/, before deciding to acquire or hold our products. As a part of our market risk management, we may take the opposite side of your trade. Our Target Market Determination (TMD) is also available at www.cityindex.com/en-au/terms-and-policies/.
StoneX Financial Pty Ltd, Suite 28.01, 264 George Street, Sydney, NSW 2000 (ACN 141 774 727, AFSL 345646) is the CFD issuer and our products are traded off exchange.
© City Index 2024