New FTSE 100 record lacks cheer
What are the chances of the FTSE 100 rallying further in the short term, after finally eking out a new all-time high?
What are the chances of the FTSE 100 rallying further in the short term, after finally eking out a new all-time high?
Ironically, the answer partly lies in the international colour of the benchmark’s money, its single biggest tailwind this year.
Whilst the pound’s 31-year lows have boosted shares of dollar-earning groups that dominate the FTSE, weak sterling leaves the gauge some 6% lower for the year in dollar terms.
The size of that discount may be immaterial for major overseas investors—Britain’s diminished currency is inflating values in financial markets worldwide—but it’s a potential headache for others.
For instance, hedging out the translation effects, perhaps with foreign exchange forward contracts, only makes cost-benefit sense for high-volume investors.
Furthermore, the investment case for would-be buyers of individual British stocks will now be most attractive when it is backed by prospects of a speedy sterling recovery.
Such prospects seem remote as Britain navigates the largely political phase of Brexit.
That is a key reason why the latest FTSE record will not get as much love from investors as previous ones.
For another thing, good cheer isn’t well distributed among FTSE shares.
34 are currently below their 200-week moving average, a trend watched closely by traders.
Some FTSE shares now trading below this important trend were even among the market’s leaders earlier in the year.
They include recovering miners Glencore and Anglo American, which have risen by triple-digit percentage points in the year to date
Only one share, Burberry Group, made a new high for the year on Tuesday, whilst a finer measures of the index’s strength—a tally of shares trending higher in surging volume—nets only 10.
From a purer technical perspective, the FTSE 100’s weaker close itself, on a record-breaking day, does not bode particularly well.
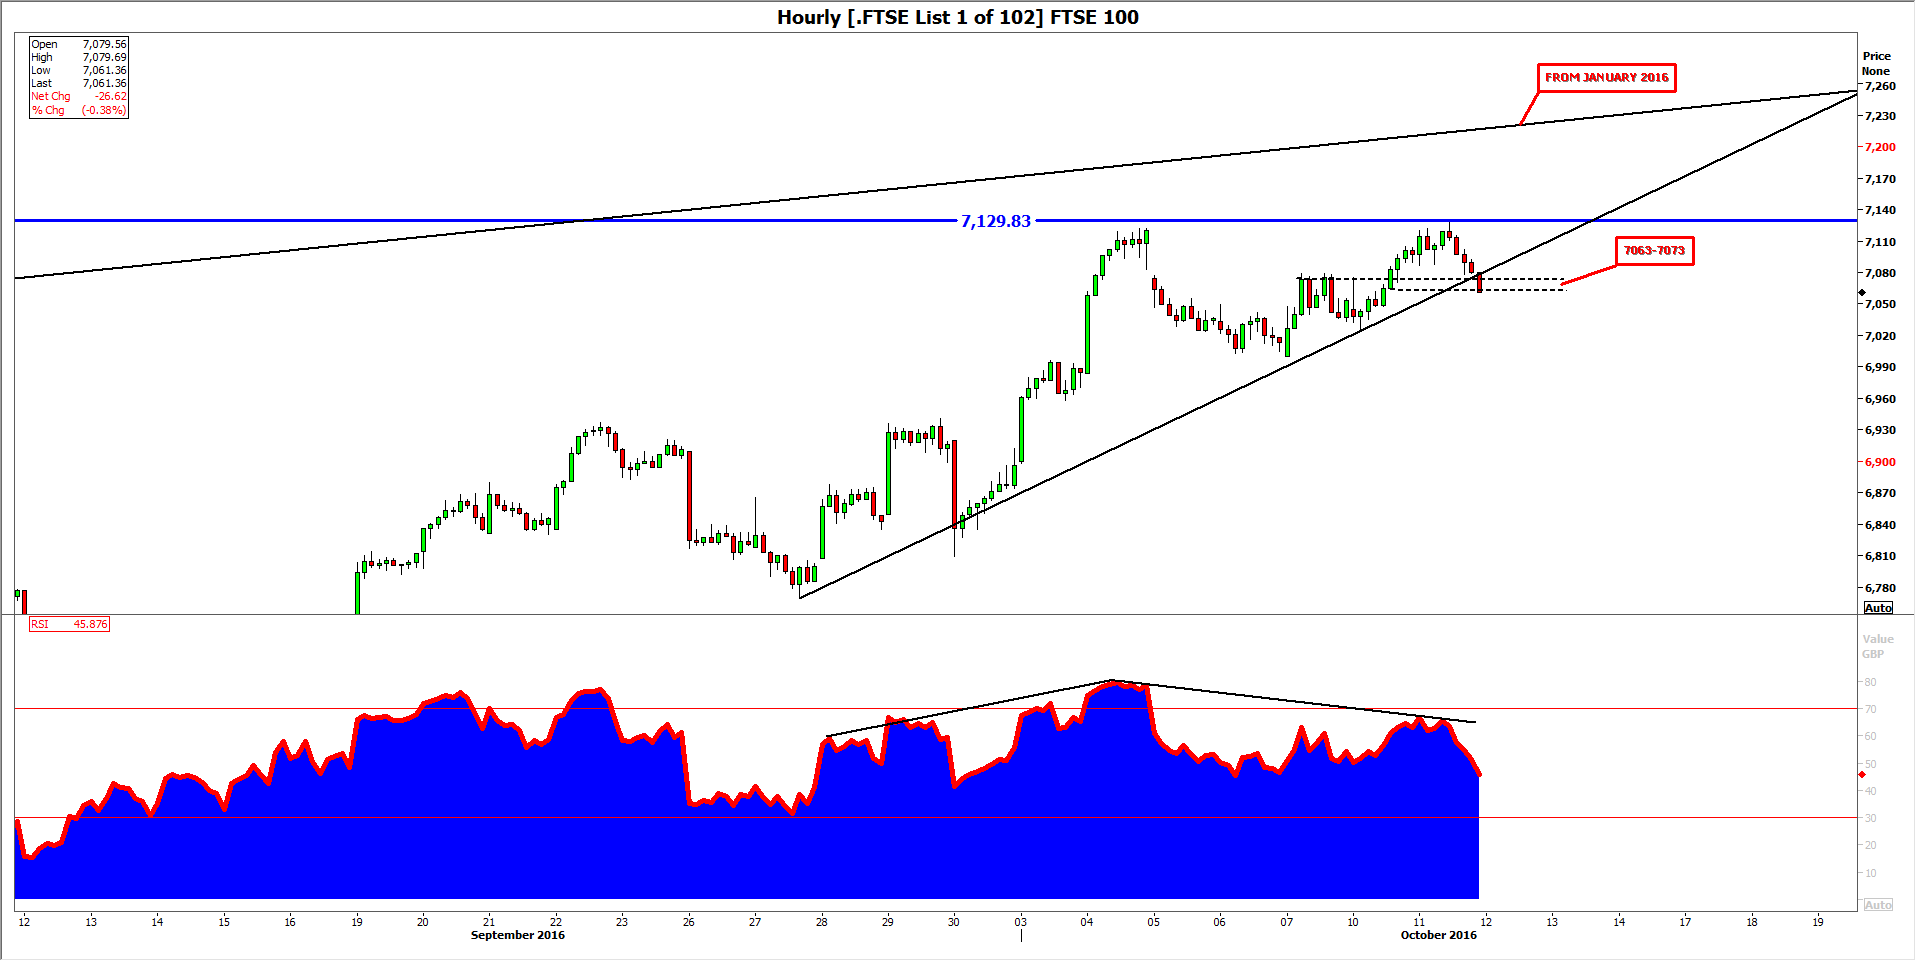
The FTSE has also caught up with its Relative Strength Index, which began diverging from cycle highs a week before the underlying index followed.
Typically, prices which fall into line after diverging from indicators tend to follow-through.
Whether or not the index could soon return above an hourly rising line that commenced late last month—which would be a bullish sign—is also in the balance.
To gauge the odds, traders will eye a breach of 7063-7073—the clearest resistance broken before the FTSE’s new high.
If patched quickly, the index could soon advance further.
If not, the chances of another all-time high in short order will be slim.
Please click image to enlarge
