GBP USD continues upside push
GBP/USD (daily chart shown below) has continued its bullish momentum as it re-approaches its new five-year high of 1.7062. This high was just established little […]
GBP/USD (daily chart shown below) has continued its bullish momentum as it re-approaches its new five-year high of 1.7062. This high was just established little […]
GBP/USD (daily chart shown below) has continued its bullish momentum as it re-approaches its new five-year high of 1.7062.
This high was just established little more than a week ago. The currency pair reached such lofty highs since late 2008.
Overall, since its low around 1.4800 in July of last year, GBP/USD has risen by more than 15% in less than a year, outperforming its major currency pair counterparts.
The current highs above the key 1.7000 level were the result of a pronounced surge that occurred more than two weeks ago in mid-June, and prompted a recovery from the pullback to 1.6700-area support.
Now pushing higher above 1.7000, the pair could soon be poised to breakout towards a new long-term high.
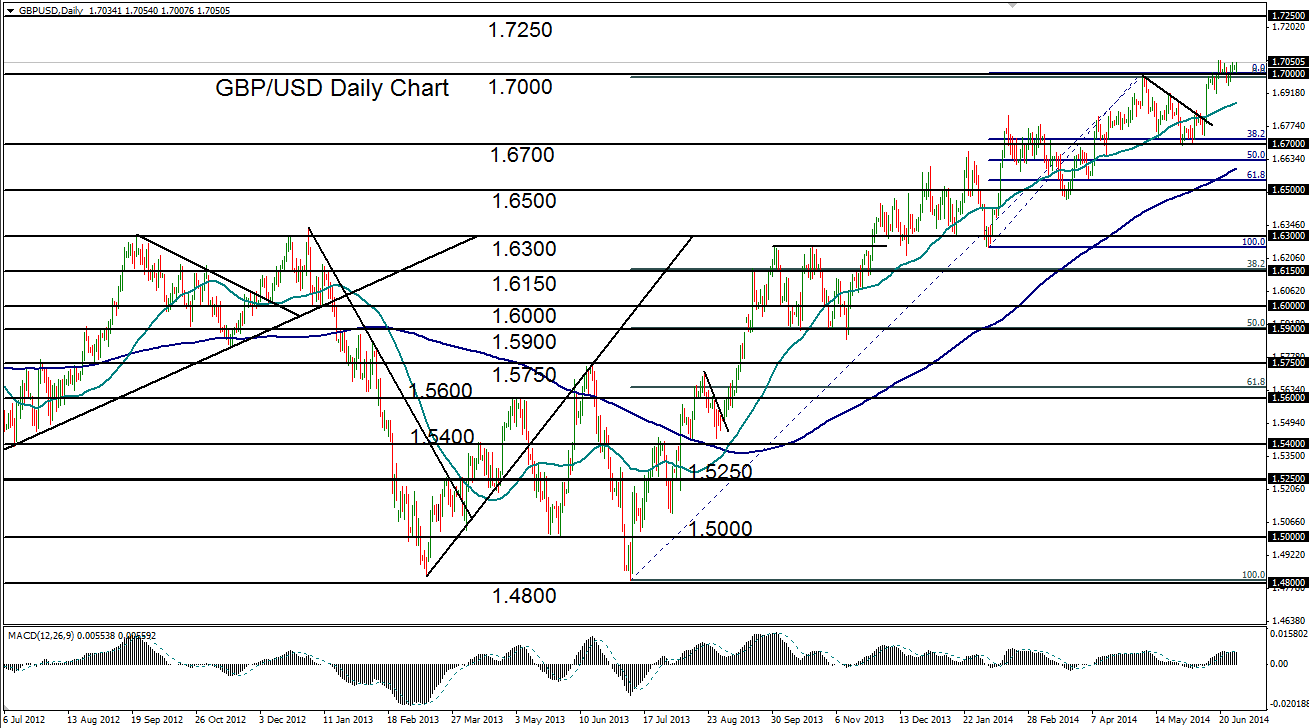
If GBP/USD can maintain its strength above the key 1.7000 level, which is in the midst of potentially transforming into support rather than its previous role as resistance, a major upside resistance target resides around the 1.7250 resistance level.
A failure to stay above 1.7000 could see the currency pair fall back towards the key 1.6700 support level.
